
Curve Tracer DIY Project developed and written by Basin Street Design.
This is for all those tube amp enthusiasts and hackers out there. I wanted to build a tube stereo amp that I could be proud of. However in the course of wiring it up I found that some 6AU6s just refused to bias where they should.
I have a 1966 copy of the RCA Receiving Tube Manual and having designed electronics of all sorts for a bunch of years, I understand that the published data on a device need be taken with a wee grain of salt sometimes. The tube data published in these books is definitely NO guarantee of behaviour in a real circuit for any one specimen.

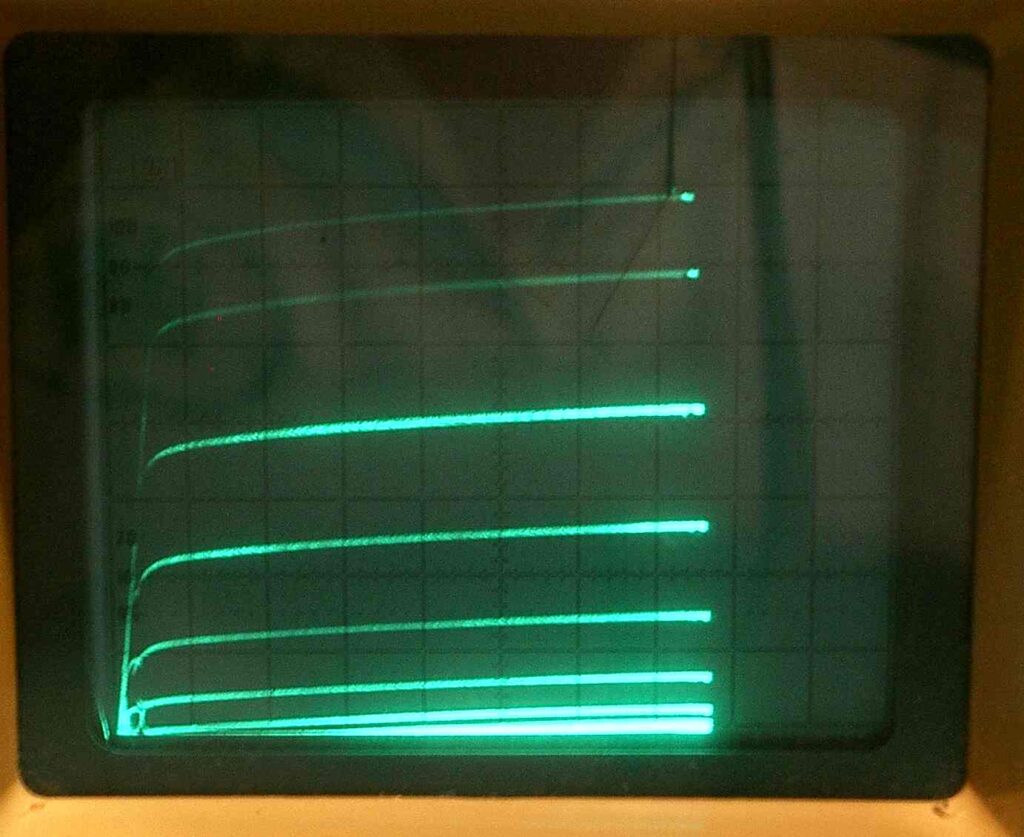
I like the little plate curve family charts, as in the picture above, in the book and THAT is what I wanted to see for the tubes I had. Using a tube tester, even a well-calibrated, high quality one will only give you one data point on one plate curve amongst that family. And you don’t even know which curve it is. It’s not very illuminating. Buying a curve tracer on the market can be expensive and rare (You may find an old TEK 570 on EBAY once a year for $3000 or up) and finding one locally is out.
So I decided to build a curve tracer. And you can see the result in the heading picture. Next, a thorough explanation of the project is provided, with the following index:
1. Introduction
A curve tracer is a machine which will plot the Voltage-Current characteristic curves for a device such as a transistor or diode or something else.
In this case we focus on the plate V-I characteristics of tubes. By this, I mean a curve showing what current will flow into the plate of a tube at any moment depending on what voltage is present between the plate and the cathode. This current is also dependent on the voltages present on each of the grids in the tube. A photo of a family of plate curves is shown above for the 6AU6 pentode. There are several curves shown in this photo. Each one is for a different voltage on the 1st (control) grid. I built a curve tracer for small-signal tubes to facilitate my understanding of the behaviour of some 6AU6s I was using in another project – a stereo amplifier.
2. Curve Tracer Design
This section describres the design and the first attempt schematics. There were a couple of surprises in the build but I will talk about those in later sections.
2.1 Schematics
The schematic of the first build is here:

The green line encloses all of the circuit on the small hand-wired circuit board that will be shown below.
2.2 Strategy
I needed:
– a circuit that would be relatively simple but would provide a high plate and screen grid voltages,
– the stepping control grid voltage with steps of ½ V, 1V each, etc, for the bias voltage,
– a circuit to measure the plate current.
Both plate voltage and plate current readings were then output on BNC connectors to an oscilloscope operating in A-B mode so the final chart of these two quantities could be plotted against each other.
Next, each function of the schematic is explained.
2.2.1 Plate Drive Voltage
For the plate drive I used a half sine wave straight off a high voltage transformer winding since I realized that the plate current would follow the same characteristic path going up the wave as coming down.
The wave form need not be precise, calibrated or any particular shape as long as it rose and fell in a non-abrupt fashion. It did not even have to be consistently the same shape each time it rose or fell. The shape of the resulting curve is determined solely by the characteristics of the tube under test. This eliminated any need for a precision high-voltage ramp generator but I still needed to acquire the transformer for this…
The screen grid drive circuit (J2) is simply a filtered pot hung off the rectified plate voltage source with a high voltage transistor as emitter follower to drive voltage into the banana connector. The filter is fairly slow and takes a couple of seconds to settle when the pots knob is moved.
2.2.2 Bias Voltage Generator
The stepped bias generator is a cheesy 4-bit R-2R ladder type digital-to-analog converter driven by a counter advanced by the 60 Hz wave from another winding on the transformer.
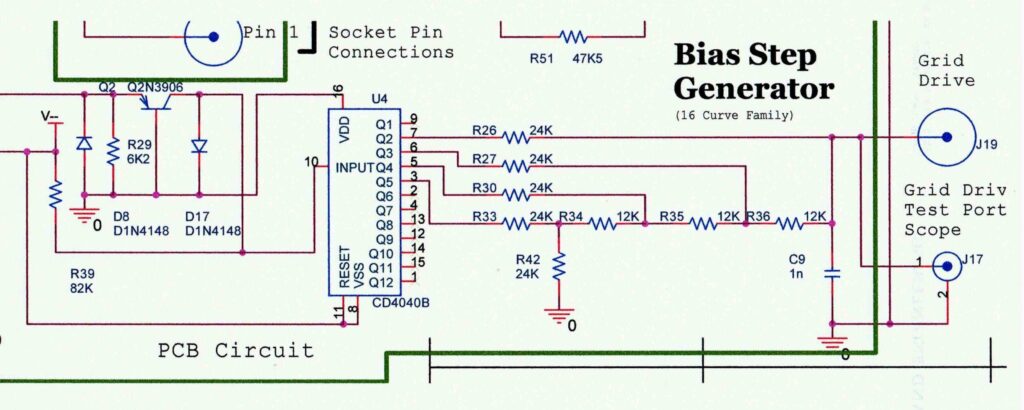
In order to keep things relatively simple and low current, 4000-series CMOS logic was used. This stuff which was ubiquitous in the 1980’s will work on any voltage from 3V to 18V. This means that the power can be anywhere in that range, it can change if needed and in fact will work even if there is large amounts of ripple or other noise on it. It’s great for battery-powered applications. It can still be had today at any of the usual outlets (Mouser, Digi-Key,, etc.) even if they are not making all of the types they used to. It also draws next to squat power.
So I used a 4040 12-bit counter I had lying around as the 4 bit counter for the stepping of the bias voltage. The step size is changed by changing the power rail voltage for it. Since the tube bias voltage must be negative the counter is operated between ground as its positive rail and a negative rail for the other end. The “VDD” pin is thus grounded. A TIP 107 with a bias network similar to the 7805 supplies the minus supply volts to the chips “VSS” pin.
A panel-mounted switch with pots for each range calibrates the maximum bias generated. The counter drives a cheap R-2R resistor ladder to make a simple Dig-Analog converter and then out to the banana connector it goes.
2.2.3 Plate Current Reading
2.2.3.1 Location
The biggest concern was measuring the plate current. I didn’t measure the cathode current since it is the sum of ALL element currents including the screen grid. Then, current was measured directly at the plate.
2.2.3.2 Plate Current Amplifier
The place where the plate current is measured (at the plate) was elevated to about 400V at the top of the wave. So after dividing the plate voltage down to 0-6V with a resistor divider so OP-AMP ICs could work with it, a large gain, very-well-balanced differential amplifier was needed. The LMC6082 dual precision OP-AMP did this very well and to boot its signal range includes ground so it could be wired up as single-supply.

The amplifier is a conventional differential amplifier as used for instrumentation but with a gain-changing toggle switch to give it two ranges of output and two pots for range calibration. This gives 2V/1mA and 2V/10mA output scales.
2.2.3.3 Current Sensing
Since the plate current is sensed with a 100 Ohm resistor, R1 in series with the plate, its voltage is elevated to about 400V. It was made smaller with two resistor dividers, one for each end of the 100 Ohm resistor. It is shown as R3, R4, R5. R6 on the schematic and the small-value pot and placed near the Push To Test button on the schematic. The pot balances these two dividers so that the output of the amplifier reads zero when zero current flows in the plate of the tube (see calibration section below).
I first used some old large value resistors for the R3, R4 but when I tried it out the curves I got looked more like word balloons than single lines. I include a pic of what I saw:
You can also see that the display is a little crushed into the baseline. I changed these resistors to more modern 5% resistors and re-calibrated. Same thing but a little less. Each curve on the display takes 1/120 second to trace with the scope spot first going up the curve then coming back down the same way. But between those two excursions the resistor would heat then cool enough to change their value! Resistors will change value depending on temperature, not much but will do so. I didn’t think it could happen that fast but changing them again to 1% metal-film types largely solved the problem.
2.2.3.4 Calibration
When I turned it on I found that the balance of the differential amplifier needed about 20 minutes warm-up time to settle down fairly well. After that time the 25 Ohm balance pot needed to be adjusted to give a very horizontal line on the scope when no plate current flows. After a while of adjusting this on the board every time I used the unit, it was removed to the panel and appears as the medium-sized brown knob near the red banana connectors. I don’t know why I didn’t do that sooner.
2.2.4 Devices Under Test
I wanted to have several tube sockets for the various existing base types but eventually settled on four: 7 and 9 pin miniature plus octal sockets. I also included a 4 pin socket to allow testing old rectifier tubes.
The filament voltage came from a transformer ripped out of an old ReadRite tube checker from the 1940’s which provided many filament voltages from 1.1 V to 110 V AND a switch to select them.
Finding a switching method to accommodate all of the various and sundry tube base pin-outs in the curve tracer proved to be futile at best so I avoided the whole issue and used patch cords with each numbered pin and each drive signal brought out to 5-way banana connectors. This gave me ultimate connection flexibility and prevented me from going mental trying to figure out a good switching method.
3. Curve Tracer Build
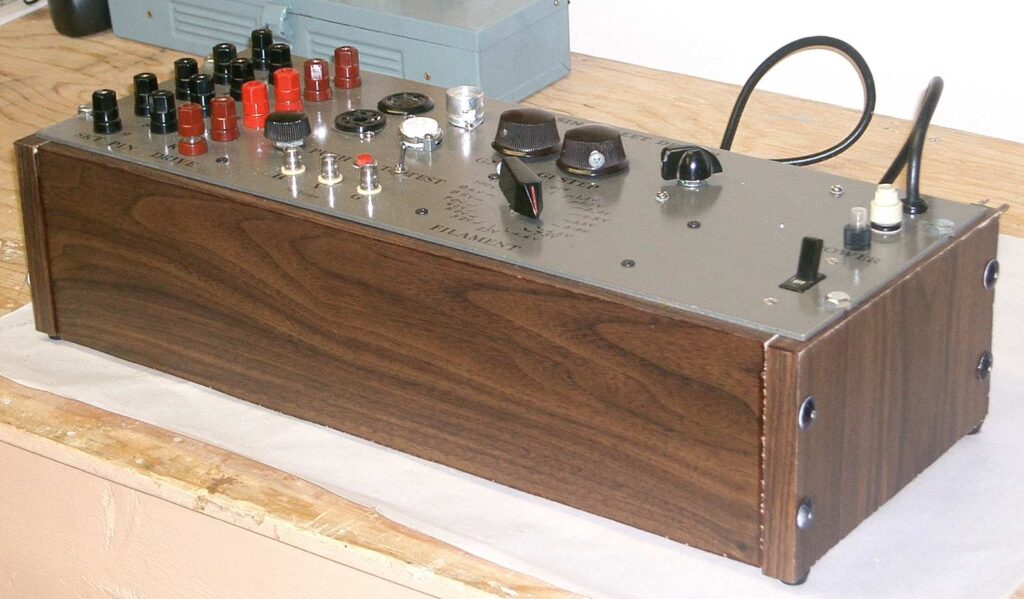
I decided I would build it on a 19” x 7” x 1/8” thk aluminum rack panel I happened to have laying around. It would be later supported by a wooden box made from scrap shelving.
3.1 Curve Tracer Front Panel
3.1.1 Distribution
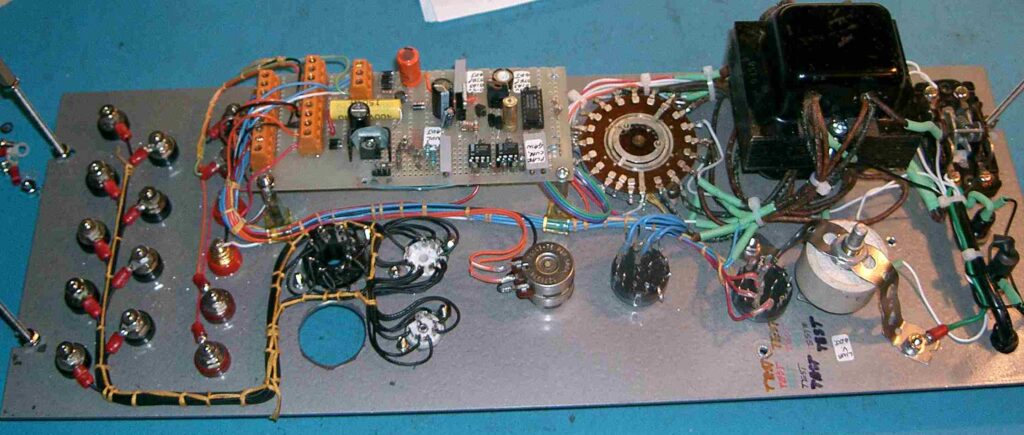
The following photo shows some of the major parts placed on the panel to determine a good arrangement. Several arrangements were tried.

The large open space represents where a hand-wired PCB would be put on standoffs.
3.1.2 Drilling
After covering the whole panel in painters tape and marking drill points, (all I had were a couple of Greenlee chassis punches and a small drill press to make holes with) I drilled all holes.

Note: always start with a small (1/16”) pilot hole, even in aluminum and work up to the larger size in steps. I used three sizes of drill bit to do the 1/2” holes for the banana connectors. The use of a centre punch is a good idea too.
The toughest hole to make was the 9-pin socket hole since I didn’t have a punch of that diameter but had to use the one for the 7-pin socket hole then file it out to the larger size. That was a job. The only rectangular hole was for the power switch. It was filed out from a round hole as well.
3.1.3 Labels
The first thing to do before any parts were on it was to label as many of the items on the panel as I could before mounting any parts. This was done with some old transfer LetraSet lettering left over from school days. As far as I know this can only be purchased in England nowadays. I then covered it in three coats of transparent spray Varathane coating. I don’t know how durable this will be over time but so far so good…

Note the steps on the filament switch were later done by hand since I had no lettering of an appropriate size:

3.1.3.1 ON/OFF
The light beige coloured fuse holder is in the upper right near the power entry hole where the cord goes. Below that are the neon pilot lamp and the ON-OFF switch.
You may or may not notice that the switch looks to be in the up position but in fact says OFF. This switch is an English DPST power switch. All power switches there are UP=OFF/DOWN=ON not like here in North America where it is the other way around. The logic used when setting electrical code for ON/OFF switches here is that when one accidentally falls against a switch it is more likely to apply downward force than upward force and so was deemed safer if whatever is controlled by that switch be turned OFF not ON. I have no idea why England is vice-versa but I liked the switch anyway. When thrown it gives a very solid “Thunk”.
3.1.3.2 Voltages
The G2 V switch is to select the voltage supplied to the screen grid. This would later become a pot. To the right, the G1 Step switch selects the size of the grid step (currently) either ½ V steps from 0 to -7.5V or 1V steps from 0 to -15V. Finally, at the bottom, the G BNC connector is the grid drive waveform so that it can be seen if desired.
For the XY oscilloscope drive, the two BNC connectors labelled H and V are vertical and horizontal signals to the scope.
To handle the selected set of valves, the drive voltages are the red 5-way Banana connectors, and the black ones are, of course, wired to the socket pins. All of the correspondingly numbered socket pins are in parallel.
3.1.3.3 Push to Test Button
The PUSH TO TEST button closes the connection to the plate of the tube under test so that it will be drawing current only when asked to do so. No point turning your back just to find out only by smell that something ain’t right! (Wouldn’t be the first time for me.)
3.1.4 Patch Cords
I chopped some unusable meter test leads into approx 7” lengths and soldered banana plugs onto both ends. Those leads are made with some great flexible wire you would have to go a long way to buy. The plugs: one red and one black as you can see in next picture. The red one is for the drive end and the black one is for the socket pin connector end; not that it matters but it seemed better that they match the colours of the connectors I had. I’m so fashion conscious.

Knowing that I would have to be able to confirm the plate current measurement calibration with a completely different method I made a patch for the cathode with a difference. I show it with a small box with a switch. Inside the box is a 10 Ohm resistor which can be switched into the circuit or out of it. The cathode “drive” is actually just connection to ground (0V). When the resistor is switched “in” a scope can be put on the cathode end of the patch and the actual cathode current of a triode can be measured to confirm what its plate is drawing, This assumes that the grid is always at a negative voltage. Normally the resistor is switched “out”.
When the switch is flipped back and forth during a test the difference in plate current can be seen with the whole family of curves shifting up and down a bit. The effect is so small (maybe 2-4%) that it makes no real difference to whatever the motive in measuring the tube is but does illustrate that even a 10 Ohm resistor in the cathode can make a visible change.
3.2 Curve Tracer Circuit Board
Next, it is explained how the circuit enclosed with the green line (in the schematic) was created.
3.2.1 PCB Build
The board is a chunk of perforated fibreglass about 2″ x 5″. I made a guess as to board size and just started sticking parts on it. My method is to build a bit – test it – build a bit more – test it, etc. This prevents one bad part/circuit from destroying many more with it all in a flash. The circuit was hand-wired using PTP technology. That’s “point-to-point” technology. Crude but any acronym makes it sound high tech, right?

The screw terminal strips are held in place with 2-part epoxy glue since there is no copper circuit on the bottom to solder it on with as is the usual case.
3.2.2 PCB Integration
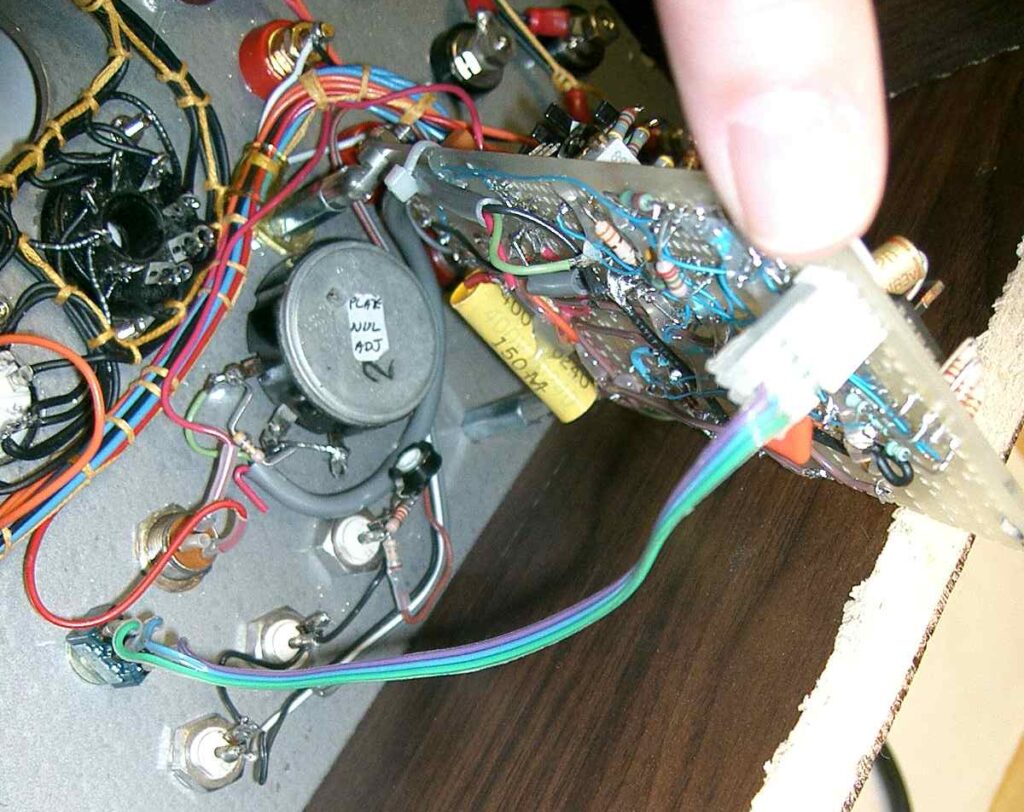
This is the result after integrating the PCB in the rear part of the front panel:
Below there are some important notes about this integration.
3.2.2.1 Cables and Wires Connection
The board uses screw terminals to connect wires so that I could remove the board for further construction/changes after testing parts of it. I put it on hinged standoffs on one end and straight ones on the other end so that I could lift it for access to the other side for quick measurements or changes without needing to disconnect a million wires.
3.2.2.2 The Transformer
As you can tell from the picture, I began lacing up the wiring instead of bundling them all with plastic ties. I have always admired the look of a well-laced harness and wanted to try it here but there was no lacing cord to be found anywhere. Maybe some of you know where it can be had. I used some embroidery thread suggested by my wife pulled over a lump of wax. I used the standard lacing knots for my harness. For those willing to learn this arcane art, Googling “harness lacing” brings up a couple of how-to sites.
The old ReadRite tube checker had an interesting method of calibration. By putting the ends of a ceramic pot across part of the primary winding and connecting the wiper to the line voltage source, the voltage that the tester operated at could be adjusted above or below nominal to take care of local variations in wall voltage that may happen from time to time. (Remember this stuff was designed and used during WWII era times.) Well, this pot just had to be included here since the transformer was designed so that neither end of that part winding was at nominal line voltage and so could not be used as-is. That pot, which gets fairly hot, can be seen as the white object held by the perforated plumbers metal strapping near the transformer.
By the time I got to discovering what all of the anonymous leads on the old ReadRite filament transformer were, I discovered, of course, that it had a high-voltage winding! So my plate voltage source was solved and I eliminated one transformer.
3.2.2.3 Voltage Regulator
For the most part, heat was not a concern but I put the low voltage positive regulator on a small heat sink for the sake of safety. Those 3-terminal regulators such as the 7805 that I used can dissipate about 1 Watt with no heatsink but it is always good to keep things cool when there is any chance to do so cheaply.
Its ground terminal is biased up to +10V with a 2N3906 transistor and a couple of resistors. This gives the +15V that the differential amplifier runs on. This is a good way of getting any voltage you like from one of those common regulators. Variability or programmability can be had the same way by using a pot or D/A converter in place of one of the resistors. Since a variety of AC voltages are available from the transformer it was easy to choose a voltage for this regulator. 25V was it. And since it draws so little current half wave rectification did fine to supply the regulator.
3.3 Curve Tracer Box
The box, like all other parts of this project was put together out of scrap material on hand. It is a simple four-sided box with no bottom but screw-on rubber feet. The pieces were jig-saw cut out of a spare particle-board bookshelf which had 3 sides covered with the same veneer as the top and bottom sides.

The cuts were made keeping in mind that the edges with veneer should show on the front of the box. Unveneered edge was inescapably shown on the back and bottom. All the pieces are held together with particle board screws left over from some Ikea kitchen cabinets from 10 years ago. The screw heads are covered with white plastic push-on screw head covers from the same source and then coloured black with a permanent marker.
In total, the curve tracer box took about 2 and ½ hours to make.
4. Curve Tracer Performance
4.1 Measurements
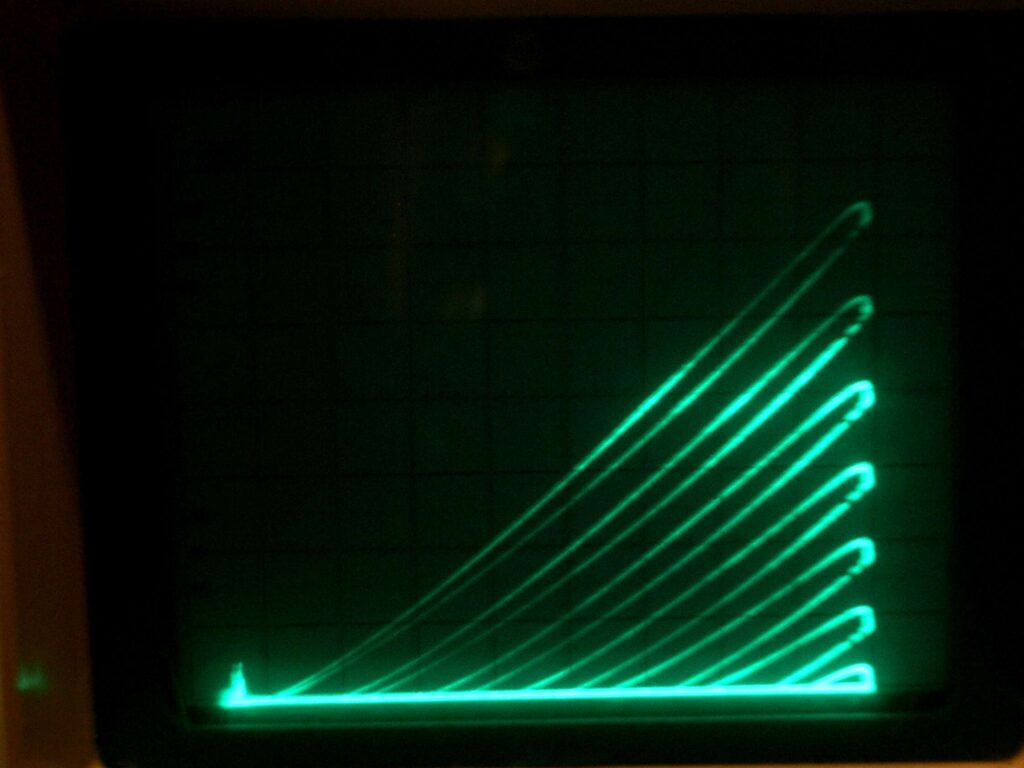
Shown a screen shot of obtained curves for a 6AU6A pentode:
Since each curve on the display is generated in 1/60 of a second and there are 16 to a scan before it repeats, then scans come at about 4 scans per second. This flashing works but is not really fun when trying to make a measurement. One solution is to capture each plot with a long time exposure on the camera. Or… use a storage scope. What you see is an oldy but a goody – a HP 1741A analog storage scope with variable persistence. The display will bloom after a while but for about 30 seconds presents a very watchable chart. It will store a screen, undisplayed, for hours. It does OK.
The 6AU6A has scale factors of 50V / division horizontally and 2.5 mA / division vertically. These scale factors are a combination of the output range of the curve tracer and the vertical sensitivity dialled up on the scope. Zero in all cases is the lower left corner of the screen.
4.2 Review
The unit has answered my questions about the biasing of 6AU6As and allowed me to adjust my amplifier design to take old tubes into account. Simply put they conduct more poorly as they age.
Obviously this curve tracer could be enhanced with more bells and whistles. It would be good to have a digital panel voltage meter which indicates the screen grid voltage dialled up with that knob amongst others. Also more and higher control grid bias ranges or step sizes. And while we are at it how about capturing the plot to internal memory so that it can be uploaded to a PC. Perhaps the curve tracer could be Windows based and come with a mouse. Then tests could be done from any place with internet connection. Or maybe not.
4.3 Limitations
Indeed, the designed curve tracer had electrical limitations. Apart from a couple of small problems, their capabilities did not allow power tubes to be plotted:
- The explained tube curve tracer could generate the plate voltage-current characteristic curve for a family of 16 grid voltage levels. The grid bias generator could generate either ½ Volt or 1 Volt steps only. Thus the maximum negative grid bias available was -15 volts as the grid was stepped from 0V to -15V. This allows only small signal tubes to be traced but not anything that needed greater bias.
- Also the vertical output, measuring the plate current, was at most 10 mA per 2Volts out. The vertical amp would run into the power rails at +15V so that limited the maximum plate current displayable to 75 mA. I needed to display much larger currents for power tubes.
Two main sections of the curve tracer had to change. The stepping bias generator and the plate current amplifier. This is explained in the next section.
5. Upgraded Curve Tracer
The curve tracer was upgraded to allow power tubes characterization and improve several problems.
5.1 Updated Design
5.1.1 New Schematics
I include pictures and a PDF of the new curve tracer circuit in its entirety here.


5.1.2 New Build
Being as lazy as ever, I constructed the new curve tracer circuit on the same 3” by 5” proto board I had already used. I cleaned off the previous stairstep circuit and started putting parts for the new circuit on. You can see that I ran out of room after completing most of it.

The final output buffer had to be put on its own piece of proto board. And, as usual in my slovenly style, I just epoxied it onto the end of the existing board. On testing it, I accidentally blew it up with the scope probe and so it had to be ripped off and re-built. You gotta watch that scope probes don’t short together points that the machine just doesn’t appreciate being shorted together.
All the modifications are thoroughly explained below.
5.2 Plate Current Calibration
I decided to change the pot used to balance the vertical output to the scope, R5. The pot I had was very noisy and was becoming a pain in the tush. After changing it out for the next lowest value pot I could scrounge up (50 Ohms across a 10 Ohm resistor) I show just what effect it has on output by connecting the unit up for regular operation:
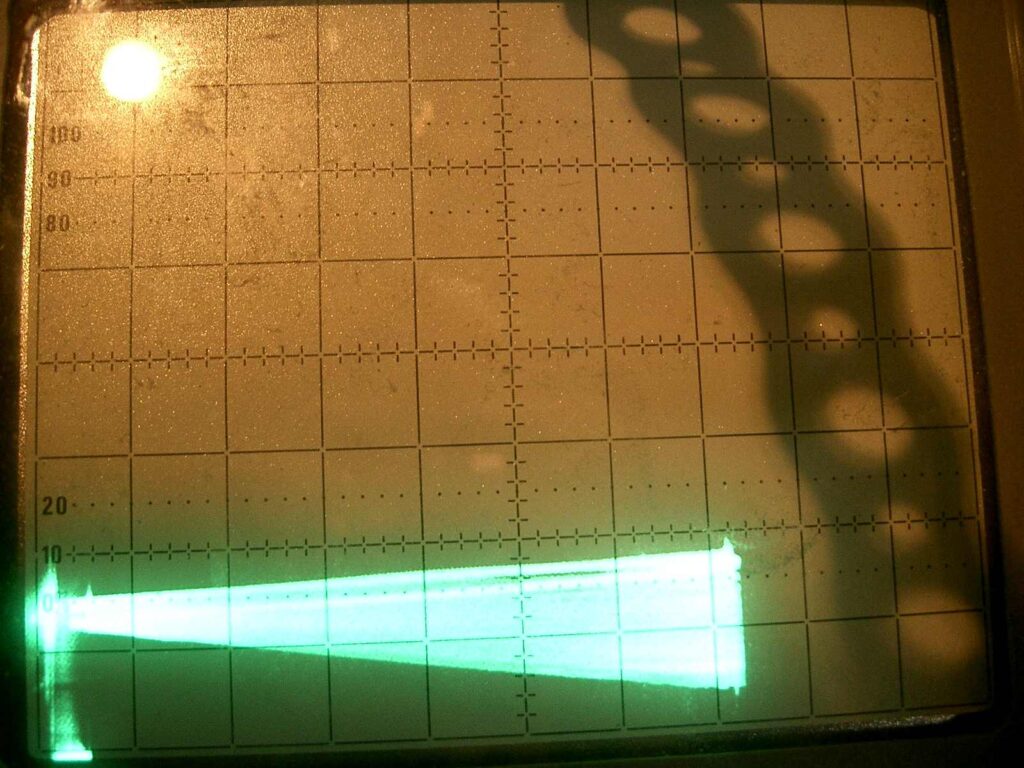
It shows a horizontal line with no plate current being drawn. The vertical gain of the scope is magnified 10x to show this. I adjust the new balance pot from end to end with the storage scope painting all points on the screen. It shows that with no plate current a non-zero vertical signal can be generated from the plate voltage waveform which is a half sine wave. This would tilt the whole family of curves up or down.
5.3 Screen Grid Supply
5.3.1 Noisy Potentiometer
First I talk about another small problem which I had – the screen grid Supply. The pot which dialled up the screen grid voltage was doing some funny things. I took a while to find a loud SNAPPING noise that would occur every few minutes but otherwise left the unit unharmed. It was the pot. Apparently it’s not a good thing to put up to 400V across one. Sometimes the contact with the wiper was not good and when it lifted, nothing would happen but would re-connect with a loud SNAP. So the screen grid circuit was changed to allow much lower voltages on the pot.
5.3.2 Reduce Potentiometer Voltage
In the old circuit the high voltage from the transformer was rectified by D4 and stored on C1. This created about 400V on C1. Thus the pot did indeed have about 300V across it. In the current circuit (picture below), the 400 volts is reduced to about 25V dc by the voltage divider made up of R10 which is two 390K resistors in series and the pot itself:

Cap C2 removes high-frequency noise. The wiper of the pot drives the base of Q2 which is a high voltage NPN transistor. Hence, the lower the base of Q2 is, the higher its collector rises. The collector load, R25, needs to be a very high value resistor so that it will not draw very much power and yet not be so high-valued that it cannot drive the base of the following emitter-follower, Q5. Its value needed to be in the 50K to 75K range. I didn’t have any 75K 2 Watt resistors so I used eight 1/4 Watt resistors in series. Cap C1 also removes all of the ripple. In fact it time constant is so long I need to wait a few seconds for it to settle once the pot is moved.
The whole circuit was built onto the pot itself. R25 is the folded-up string of resistors just to the left of the pot. As illustrated in the photo in section 5.1.2.
5.3.3 Circuit Protection
Resistor R27 was put in should the wiper of the pot lift off the pot element. I didn’t want base of Q2 to go open, thus turning Q2 off and letting its collector and the output go right up to 400V. This way if the wiper goes open (as most pots do with age) then the output will go to minimum voltage, not maximum.
5.4 Plate Current Amplifier
5.4.1 Previous Limitations
I’ll take the plate current amplifier next because it was the simpler change of the two main redesigns. In order to show a larger current displayed on the scope the plate current output amplifier’s gain had to change. As it was it would saturate into the rail at about 75 mA max on the 10 mA/2V output range.
5.4.2 Lower Current Amplifiers Gain
Preventing saturation at even higher plate currents meant lowering the amplifiers gain. I chose to reduce it by a factor of 5. Since the configuration of the amplifier, made up of U5 A and B and U6A is a standard instrumentation amplifier where two op-amps, U5A and U5B, are connected as a differential pair with common gain-setting resistors, the gain is determined by the resistance between U5 pin 2 and U5 pin 6.
This resistance is made up of a pot and a fixed resistor. Two such combinations were in the original design and were chosen by flipping a toggle switch mounted on the panel. I replaced the toggle switch with a 4 position rotary switch and adding another pot/resistor combination for the new range:

5.4.3 Calibration
The gain of this differential pair is set according to the following relation: If the pot/resistor combo is called Rx then the gain G is:
\begin{equation} G=\frac{R_8}{R_7}·\frac{R_{14}+R_{19}+R_x}{R_x}\end{equation}
The Rx value for the 50 mA/2V range can be found by re-arranging this equation for Rx and plugging in the known values for the resistors and the desired gain. It becomes Rx:
\begin{equation} R_x=\frac{R_{14}+R_{19}}{G\cfrac{R_7}{R_8}-1}\end{equation}
The pot always needs some adjustment to bring the unit into calibration. In the photo (section 5.1.2) is shown the chicken-head knob over the word “TEST” that switches this range. The fourth position is unused but is just waiting for some circumstance to come along that will make using it necessary.
Before calibrating the unit it is only necessary to make sure that the gain adjust is wired up correctly. I put in a 12AU7 tube with jumpers and with suitable bias (0 to -15V) for that tube tested it to see if the pot will alter the vertical dimension of the display. It did. At this point I crank the pot from end to end to confirm that the range includes what should turn out to be the correct value (1/5th as tall as that of the 10mA/2V range).
I will wait until there is a power triode in the socket before describing any final cal (see section 5.6).
5.5 The Bias Generator
The bias generator of the curve tracer was by far the most complicated part to change. That circuit grew more than 3 X the original size. If you will bear with me I will also explain how every part of the new generator circuit works, with scope screen shots. If you can see the philosophy of operation by just staring at the schematics below then more power to you and you can skip this section.
I used the same philosophy of stairstep creation here as before: that of a 4-bit counter whose output is converted to analog with a R-2R ladder circuit…
The bias generator must accomplish several things:
- Firstly, it must advance the state of the counter each power line cycle. It must do this when the transformer output swings negative when no waveform is being shown on the scope. Remember that the scope trace is shown only when the plate is driven positive.
- Secondly, it must amplify the 4-bit counter output levels to that of the maximum bias level, up to 60V negative and then convert those 4 bits to an analog voltage.
- Thirdly, it must accurately generate that maximum bias voltage level so that it can be applied to the D/A conversion.
- Finally, it must finally drive the resulting waveform, up to 60V P-P, out to the tube grid or scope connector without distortion or loading.
5.5.1 Schmitt Trigger
5.5.1.1 Schematic
The first item is a Schmitt trigger implemented by U6B. This was the one op-amp left over from the plate current amp. And therefore runs from the same 0V and +15V rails as it does.

5.5.1.2 How it works
The input which comes from the 70V tap on the transformer is attenuated by about 6:1 by R73 and R74 to about 16V peak and still retains its sine wave shape. Protection diodes D19 and D20 prevent the wave from going outside the power rail limits of U6B.
The op-amps +ve input is biased to half the +15V value. Thus when the input goes above +7 ½ V the output will go low to close to 0V. When it goes below +7 ½ V it will go high close to the +15V rail. Actually since the feedback resistor R77 is there, the op-amp needs to go some distance beyond the +7 ½ V(either way) before the output will switch. In this case it must travel an extra 0.75 V each time. This adds 1.5V of hysteresis.

The output of the Schmitt trigger feeds the clock input of the counter.
5.5.2 Bias Voltage Supply
5.5.2.1 Schematic
The bias voltage supply has the responsibility of generating a calibrated voltage from less than -7V to over -60V which is to serve as the maximum bias value.

5.5.2.2 Stabilizing the Supply
First the 70V tap from the transformer is rectified by D18 and stored on caps C7 and C13 to produce -100V with some ripple, about 1 V P-P. The two resistors R43 and R83 make sure that that this 100V is split more or less evenly between the two caps. Without this, the two caps may split the voltage unevenly and allow one to be operated over-voltage reducing its life considerably.
Transistor Q12, voltage standard U9, pots R78-R81 and resistor R39 form a voltage regulator to create more ripple-free -75V at the bottom end of R48. If the bottom end of R48 (where it says “-75V Reg.”) should “rise” a bit (go toward larger -ve voltage) then the base of Q12 would be pulled “up”, too. Since its emitter is held to a very constant -2.5V by U9 then Q12 would be turned on (more than it already is) and attempt to pull its collector down towards ground. Of course, when I say “down” I mean that the collector would go positive towards ground. This pulls more current through R48, reducing the original tendency. This action reduces the ripple at the bottom end of R48 to about 0.22 V P-P.
Pot R82 is adjusted to set the operating voltage at the collector of Q12 to about half its maximum safe value, about -20V. 36V Zener diode D22 is there to prevent the collector from exceeding that safe range (40 V) for any reason. Should the -75V point fall towards lesser negative voltage then the reverse would happen: the base of Q12 would “fall” a tiny bit; Q12s collector would rise towards more -ve voltage and the -75V point would be stabilized.
5.5.2.3 Voltage Step Size
Since a stable -75 V is now created, then any point along one of the pot strings, with R78 thru R81, is also stable and can be selected to provide a stable maximum voltage for the stairstep generator. Four voltages are created at the wipers of the pots: -7.5V, -15V, -30V, -60V and then selected with the switch. Cap C10 removes any residual noise.
But this voltage needs to be buffered to produce a low impedance source. U8 does this. Since 741 op-amps cannot withstand more than 44V max across its power pins, then it needs to be helped. Transistors Q13 and Q14 are driven by the output of the op-amp to shift the + and – voltage on the 741 power pins so that those voltages are near to the buffered pot wiper voltage, be it -7.5V or -60V. The 741 is actually run on about 36 V between + and – power pins.
It can be shown mathematically that regardless of what voltage is input to the 741, this 36V difference never changes but just shifts up or down as needed within the total 100V available. The transistors Q13 and Q14 also can stand only 40V max across them. This places another limit on the maximum signal amplitude that can be handled. This fact comes into play in the output buffer, U7A.
5.5.3 The Counter
5.5.3.1 Schematic
The 60 Hz positive edges from the Schmitt trigger advance the count of the 4-bit counter.

5.5.3.2 How it works
I generate a 16-member family of curves with this 4 bits. But each of them switches from ground to only +15V. However, they need to switch from ground down to the max bias level (-7.5V or -60V or whatever). The transistors Q8 thru Q11 do that.
When the emitter of each transistor is pulled high by an output bit it is turned ‘on’ because current is drawn from the bit through a 15K resistor and then through the emitter-base junction of the transistor to ground. Then, when the transistor is turned ‘on’ it pulls current through it and the 120K collector resistor on its collector to the regulated, buffered max bias voltage at the output of U8.
When each of the four bit outputs of the counter go low to ground then each of Q8 thru Q11 are turned ‘off’ and those collector voltages fall to the negative bias voltage. When each of Q8 thru Q11 are ‘on’ the collectors may be pulled significantly above ground potential. The diodes D23 thru D26 prevent this. They limit that travel to about 0.6V above ground.
5.5.4 The Bias Output
5.5.4.1 Schematic
The next section is the D/A itself. This is a very standard circuit that has been around since digital logic was invented before I was born.
5.5.4.2 Digital to Analog Converter
Either end of the 510K resistor string could have been chosen as the output but only the end used as shown produces a regular stairstep wave form. So that end is fed on to the output buffer and the other end has another 510K resistor tied to ground through R68. This resistor fills in for all bits lesser than lsb which are absent.
The D/A is made up of 2 values of resistor which should be exactly 2 to 1 value ratio. As you can see mine are not but are close enough for me. IMHO making them any more exactly in 2:1 ratio has no return on investment and is so pointless.
The output impedance of any R/2R D/A string, regardless of how many bits are involved is always equal to R.
5.5.4.3 Offset Voltage
Since the four amplified bits were clamped at 0.6V above ground then the output waveform travels to +0.6V, too. I shift the whole waveform down by this amount with a tiny amount of negative current injected through resistor string R69 thru R72 from the -75V point. The value of this string is adjusted by trial and error to just eliminate the +0.6V. I get it down to about +0.05V
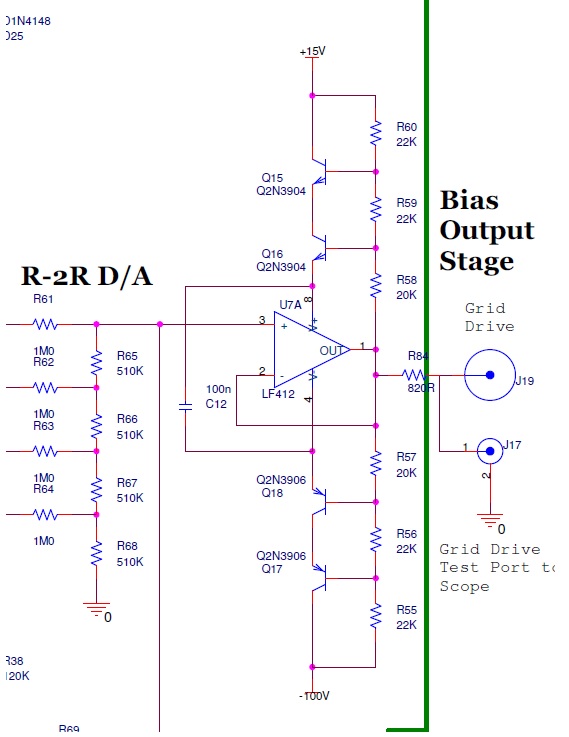
5.5.4.4 Output Buffer
The output buffer is similar to the max bias voltage buffer described in the last step with a small difference. Since it must output 0V to -60V, it needs some elbow room above and below that and so runs from +15V to -100 total power.
And since this exceeds the amount that the opamp and transistors in the previous circuit could stand before smoking, I doubled up on the totem-pole transistors to spread the voltage amongst them and limit the voltage applied to each. Believe me, I did not realized I had to do this until mother nature made it clear when I turned it on.
The opamp chosen here is a FET-input version of the 741 so that it will not load down the waveform from the D/A by drawing any current into its inputs through the D/A resistors. Even 2 uA input current would shift everything by 1 Volt.
5.5.4.5 The Importance of R84
The 820 Ohm resistor, R84, saves the op-amp if the grid drive connector gets accidentally shorted to ground.
Actually it serves another very subtle purpose, too. With the transistors in the path of the power to the chip, the op-amp becomes less stable than when used in the conventional way. This means that any reactive (especially inductive) load on the output of the op-amp can send it into oscillations. This is the kind of thing that can drive you crazy if you have no idea what’s causing them.
Having the output wired through several inches of wire to its destination can be just such an inductive load. So to isolate this inductance from the op-amp then a small value resistor of several hundred Ohms is inserted into the output wire near the op-amp. Putting the resistor at the other end of the wire would be useless. Thus, the op-amp is protected from both accidental shorting and from load-related oscillations.
5.6 Power Tubes Curve Tracer Calibration
This section provides the steps to calibrate the power tubes curve tracer.
5.6.1 Bias Voltage Supply
The first thing to calibrate is the voltage on the collector of Q12. By monitoring that point and adjusting R82, -20V approx. is obtained. Precision is not needed here. As long as the collector has enough elbow room to work in without saturating the transistor or making the zener diode come into play then it´s good. It was lucky that I used a 10-turn trim pot as its value is quite critical.

When a scope is put on the collector of Q12 then a large, inverted version of the ripple at the -100V point is seen in the lower trace of the scope shot above.
5.6.2 Bias Output
Provided the circuit works to generate the stairstep, the output at the grid drive connector was put on the scope. Now I adjusted the resistors in the light pulldown string, R69 thru R72 so that the topmost step was as close to 0V as I could manage. No pot here – just substitute value after value until it’s as right as can be made.

Next, are the four max bias pots, R78 thru R81. They are easily set by scoping the output stairstep waveform at the grid drive connector and cranking each one until the bottom (most -ve ) step is correct. I show all four bias output waveforms in one shot on the scope by manipulating the beam brightness and the selector switch while the storage scope paints the screen.
5.6.3 Plate Current Gain
5.6.3.1 Procedure
Once the bias generator is operational then the plate current gain can be calibrated. With a 6080 triode in the test socket, I used the special jumper with the switch on it. The switch inserts a 10 Ohm resistor into the cathode of the tube:

I put a scope probe on the cathode end, not the “drive” (ground) end of the cathode jumper. Then pressing the “Push To Test” button to get current through the tube, I could see the current drawn by the tube as a series of “hills”. Note that although the photo shows only 8 “hills” actually all 16 are being generated but the scope sweep was triggered only every other time:

The largest of these shows 2.25 V at its most positive peak making the cathode current 2.25/10 = 225 mA. With this figure recorded, I re-connect the setup for regular operation. Now, pressing the button shows me the expected family of plate curves but with wrong amplitude:

Finding the spot on these curves which corresponds to the earlier measurement allows me to adjust R11 to the same value. Doing this I must not change the switch on the cathode jumper wire or that would change the conditions of the test.
I also took the opportunity to touch up the calibration of the other plate current ranges, R15 for 2V/1mA and R16 for 2V/10mA out.
5.6.3.2 Limitations
The tube used for the calibration was a 6080 twin power triode. This one is designed as a regulator in power supplies and that’s just what it was used for when I ripped it out of the old Tek 545 oscilloscope. Thus, it could take a lot more current than other triodes.
Note in the shot of the plate curves captured above that the curves all don’t reach the same maximum voltage (horizontal extent). This is not a design feature. It just shows that the power transformer cannot supply that much voltage at higher currents. Its internal impedance comes into play. The lower the current drawn, the lesser this effect is but it can also be seen to some extent in the scope shots of the first device (section 4). It also reminds me that it was a good idea to include that “Push To Test” button so as not to continually stress the plate supply or the tube itself.
Another note: The transformer is not quite beefy enough to supply the filament current to this tube. With the fil. switch at 6.3V I measured only 5.23V. But switching it to 7.5V gets 6.4V at the filaments. Thus, that is what I used for testing. Normally starving the filament would make all the plate curves shrink a bit but this tube is specifically design to resist that. At least that’s the claim I read about it somewhere.
6. Curve Tracer Review and Conclusions
I will point out again that the exact waveform of the plate drive is irrelevant as long as it has no abrupt jumps. Since the characteristic shape of the relation between the tubes plate-cathode voltage and its plate current is determined solely by the device under test (the tube) then, should the exact waveform applied to the plate have wiggles and swoops these non-linearities would only change the speed or time that the scopes’ beam travelled up and down the curve but not cause it to deviate from the aforementioned characteristic path. Thus, for anybody who thinks they need a precision high voltage ramp generator or such for the plate/collector/anode/whatever then you can just as well save yourself the effort and aggravation of going that far. It makes no difference.
I found while looking at the grid drive stairstep waveform on a scope that putting a tube in the socket or pulling it out made absolutely no difference to it as should be the case.
I found this curve tracer a fun device to build and play with and still no software! Who knows how long my luck may hold out?
About the author:
B. Ap. Sci. (EE), 1977 University of Waterloo, engineer, entrepreneur, retired.
Subscription
If you liked this contribution, feel free to subscribe to our newsletter: