Low Distortion Audio Oscillator Developed and Written by Basin Street Design.
The following low distortion audio oscillator is based on the Wien-Bridge oscillator. The previous link developes the math. I get it. You can skip that if you don’t care why the Wien bridge oscillator works.
1. Low Distortion Audio Oscillator Schematics
Here is the heart of the machine, the low distortion audio oscillator is based on a balanced Wien bridge oscillator:
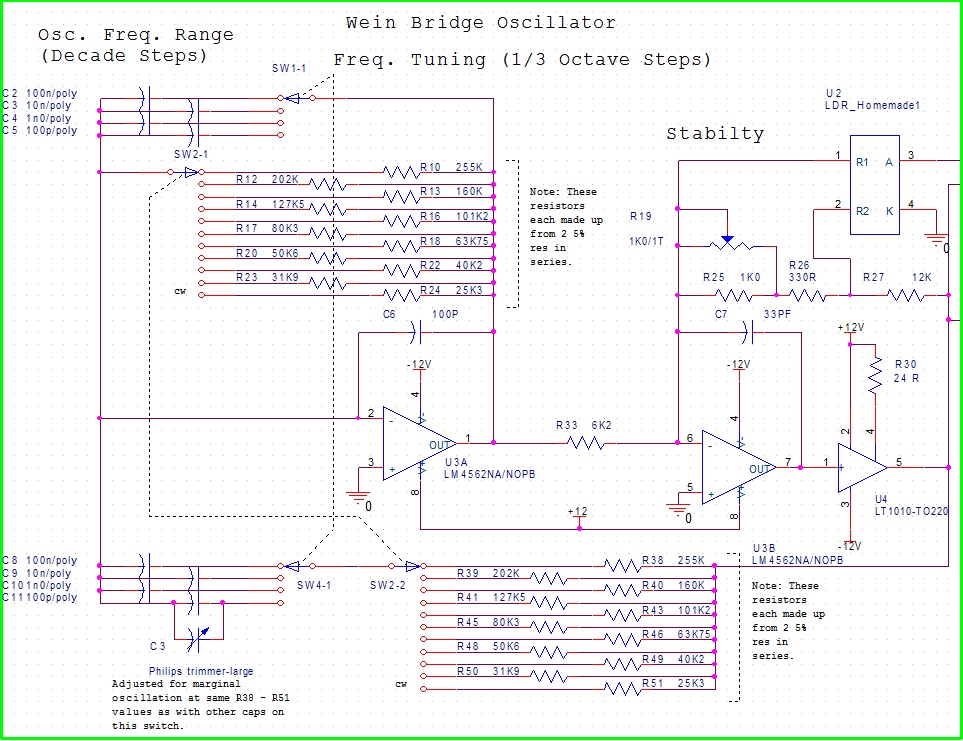
The bridge is in differential format, where the two R-C pairs are strung as follows:
– Series pair is from the output of the oscillator through the switches SW2-2 and SW4-1 to the input of the left op-amp.
– Parallel leg is from there through the parallel switches SW1-1 and SW2-2 to the output of the same OA.
Since the inputs of both OA’s are referred to ground, then the voltages across the entire bridge form a see-saw. The middle of the bridge at the input of the left OA always sits at ground (and so avoids distortion by travelling up and down the sine wave) while the two ends of the RC pair, at the outputs of the two OA’s travel in opposite directions.
Given that the values of R and C switched in are very closely matched then the oscillation frequency is reliably set at 1/(2*pi*RC).
The gain of the amp on the right is set at exactly 2 by the resistor network R25, R26, R27, pot R19 and the homemade voltage-controlled resistor, U2.
I chose the LM4562 for this project because its datasheet claims some impressive distortion figures right off, but I know that almost no real-life circuit will perform as well as the perfect-case claims on the datasheet. Still, it is a very good start to achieving professional-class distortion figures. Since the input voltages on the op-amps do not travel over a large voltage range then variations in their input impedances are made very small. It is these variations which introduce distortions on the order of 0.001% to 1% in lesser chips.
2. Wien-Bridge Oscillator Bread-Board
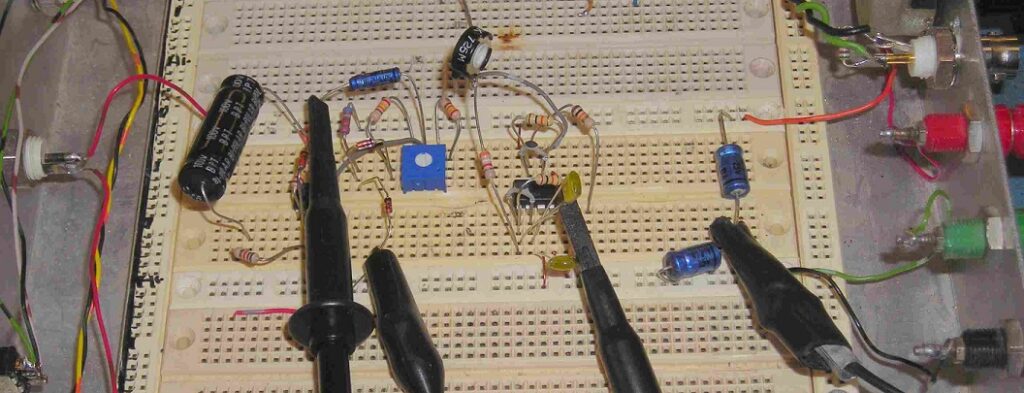
First try of the oscillator circuit. The gain trim is the small black pot in the middle:
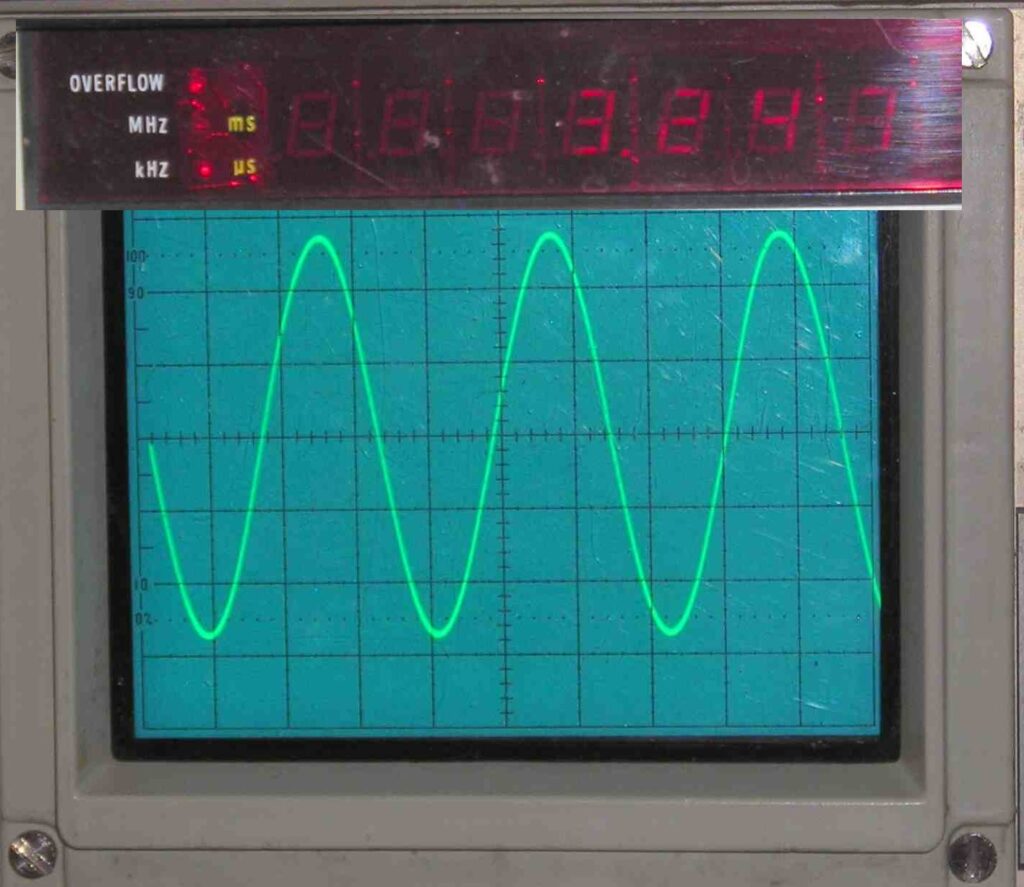
It oscillates! At 3.247 KHz:
By adjusting the gain trim by microscopic amounts and holding my tongue at the right angle – distortion can be made to disappear below the spectrum analyzers ability to see it 90 dB below the fundamental! (That’s 0.003%):
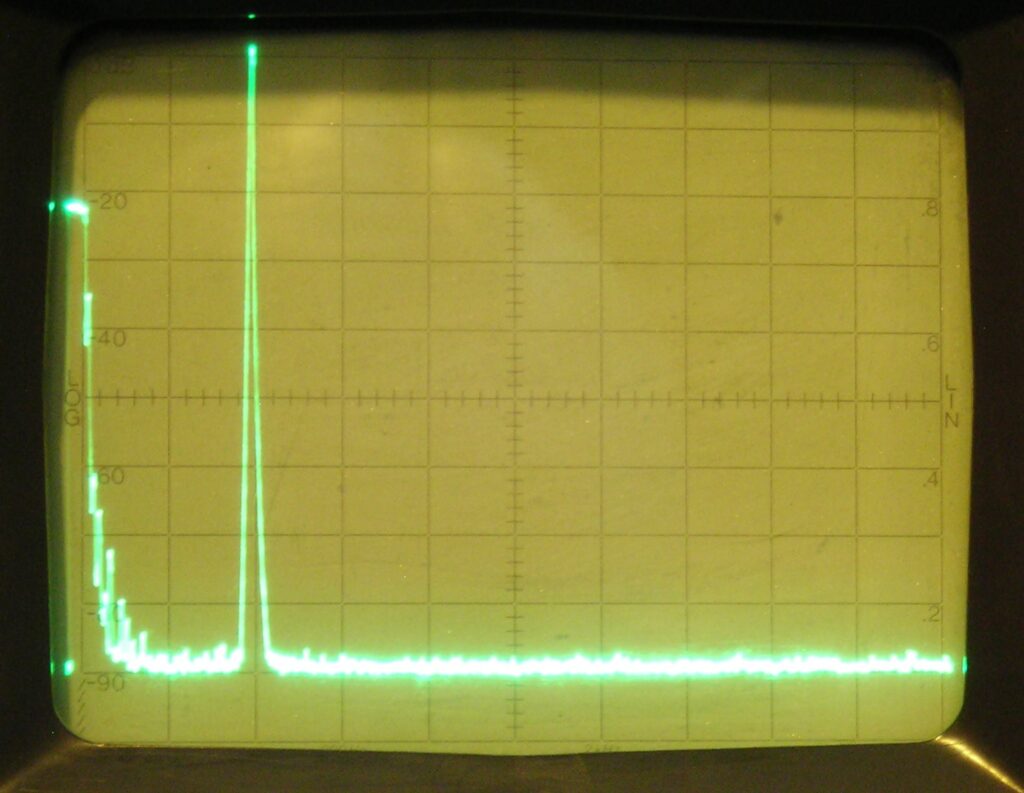
So just how far down is it? This can be found only if the op-amps gain can be automatically controlled by a relatively slow feedback gain adjust circuit. It also means that to see the distortion products, the input sensitivity of the spectrum analyzer must be cranked up. But if I try that now the fundamental will just overdrive the input circuits of the spectrum analyzer and all I will see are LOTS and LOTS of internal distortion. To get around that I have to eliminate the fundamental tone from the signal with a notch filter first. THEN crank the sensitivity as much as I can to bring the distortion products up above the noise floor. Explained below you can find how I included such a tunable notch filter into the final unit.
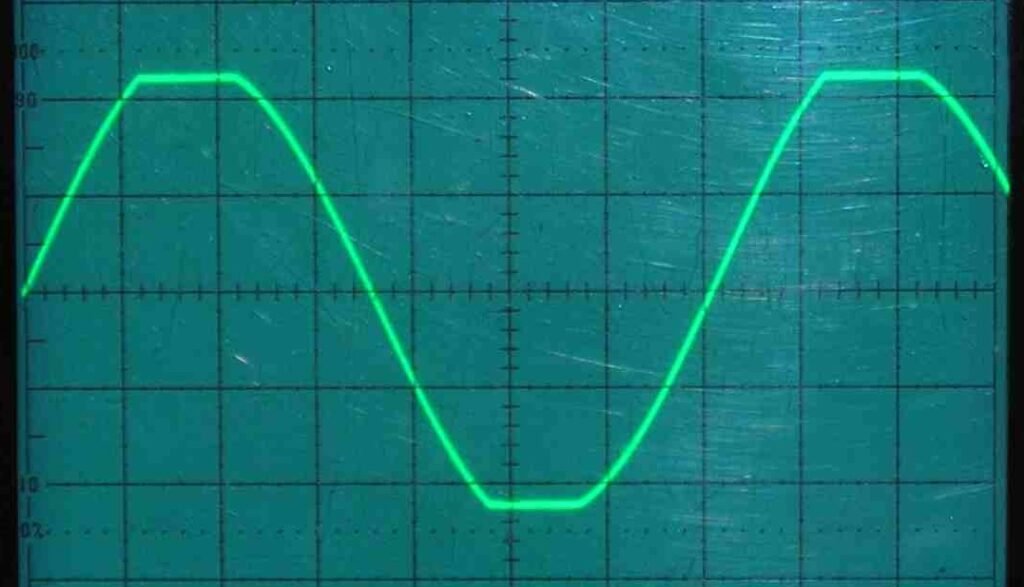
Note the op-amps gain is a critical parameter. If it is not well-controlled then oscillation may grow until it runs into the rails of the op-amp increasing distortion. Or else it may shrink until it completely disappears. The first option is illustrated with the following example:
3. Hand-Made Test-Bench Low Distortion Audio Oscillator
3.1 Mechanics
The selected build box is an old Heathkit sine/square generator that doesn’t work anymore (model IG-18, working units can be found in Ebay). I ripped all of the electronics out of it to leave just the box and controls and part of the power supply intact.
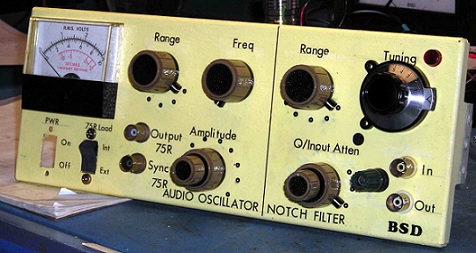
The front panel was denuded, sanded and painted. I couldn’t use any of the original markings since they would not match up well with the switches I intend to put in. Also I decided to build TWO circuits into this box, the oscillator and a tuneable notch filter that I could use to suppress the fundamental with so that more sensitivity could be dialed up on my spectrum analyzer. That part will be described later. The following picture shows the ultimate front panel with switches and pots mounted. You can ignore the meter on the left for now, I haven’t figured out what to do with it, yet.
Next picture illustrates what it looked like inside:
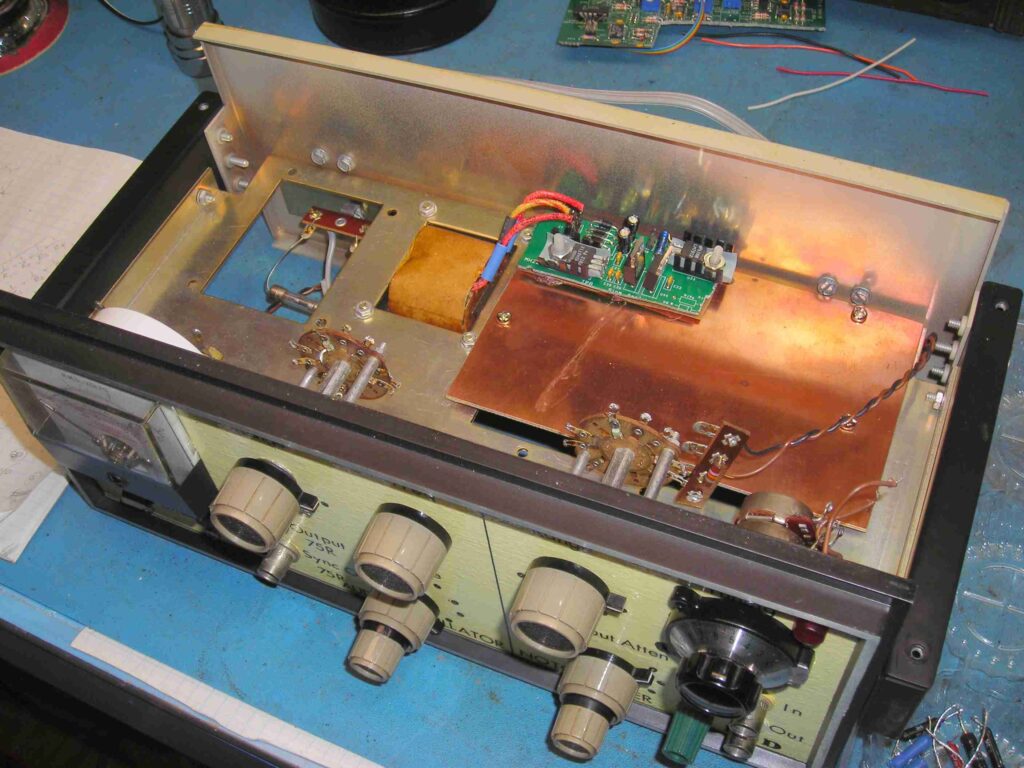
Components on the switches were removed and the switches were modded to suit the new functions. Getting these switches reworked and mounted was not a small amount of work. The copper-clad board is just a blank canvas at this point. The switches are fixed up now and I have a small power supply to give me regulated +/- 12V and +5V.
3.2 Electronics
3.2.1 Oscillator
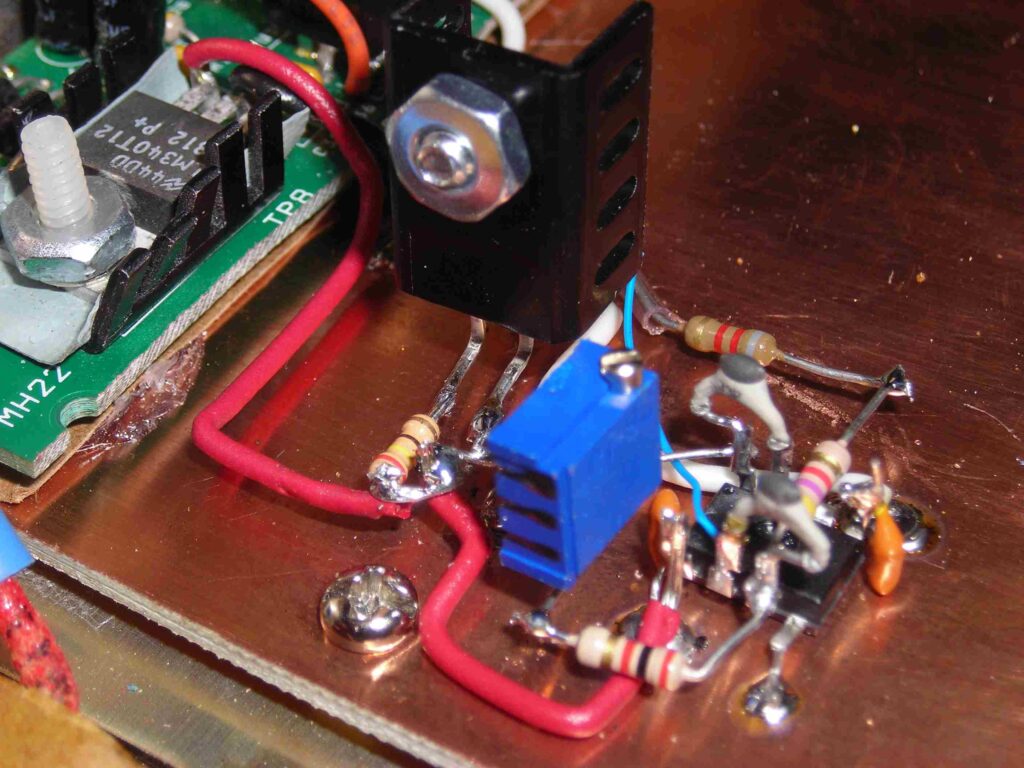
Here is the Wien bridge oscillator (without AGC). The blue pot is a provisional gain control. By adjusting that for a good sine wave (for a few seconds) I can see how well it oscillates on the spectrum analyzer. The chip on the little heat sink is a Linear Technology LT1010 power driver, U4 in the schematics above. The driver is necessary because the load on the oscillator is about 300 Ohms total.
3.2.2 Frequency Tuning
Now it’s frequency changing time. This is the frequency range switch which changes the value of the C’s in the series-parallel RC network:
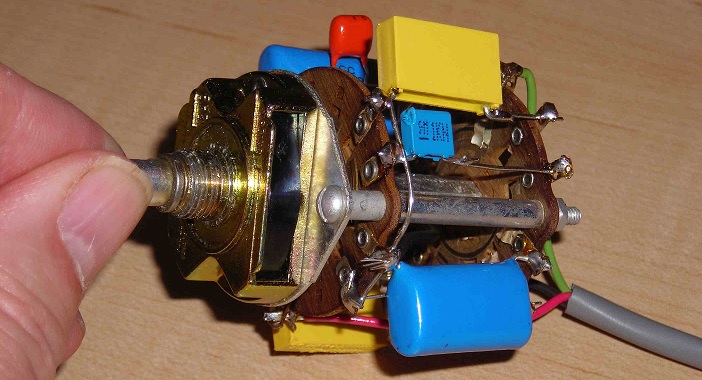
It changes the resonance of the oscillator by decades. It has 6 – 60Hz, 60 – 600 Hz, 600 – 6KHz and 6 KHz – 60 KHz settings. Interestingly, by using large time constants I have seen this oscillator happily generating perfect 0.06 Hz sine waves and with no settling time to do it. And all the way up to 40 KHz sines.
This is the other frequency-setting switch. It changes the R’s in the same networks:
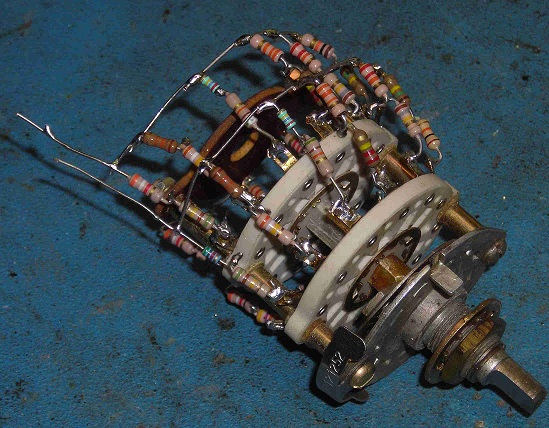
With 11 positions it changes the resonant frequency by 1/3 octave steps over one entire decade. 1/3 octave is about a 26% change going upward or 21% going down. The lowest frequency generated by the circuit is about 6 Hz and the highest one reliably generated is about 37 KHz.
OK, I can hear it now, “Why not just use two pots on a common shaft?” Because the resistance tolerance of commercial pots is pretty crappy at best and the tracking of the resistances from one pot to the next is even crappier. To the point where the oscillator may fail to start up at all or may quit in the middle of turning the knob to adjust the frequency. And I tried them; they do just that. I decided that I could live with discrete frequency selection and that 1/3 octave spacing was good enough.
3.2.3 Loop Gain Control
Operational amplifiers gain must be controlled automatically to achieve a low distortion audio oscillator. That is the task of the loop gain control.
3.2.3.1 The Concept
Here is the loop gain control:
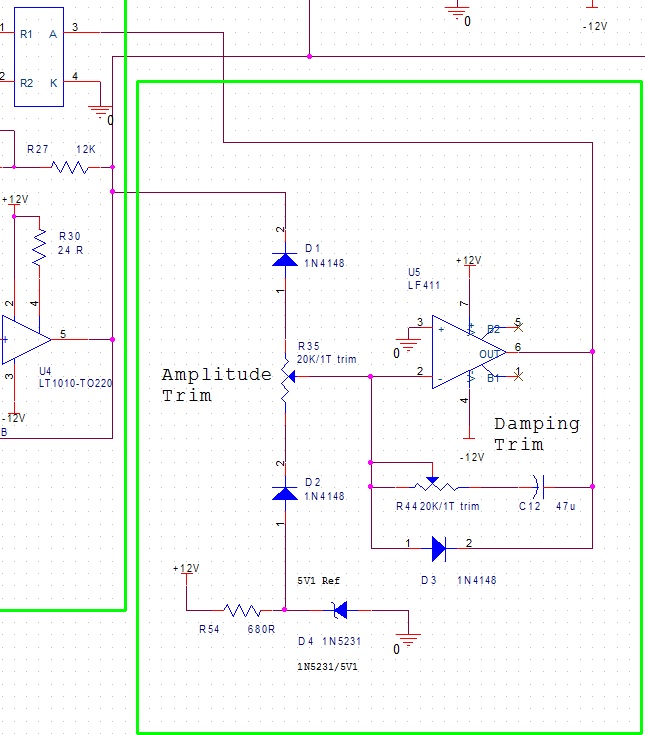
This circuit uses a 5.1V reference on D4. It compares the peak level of the oscillator output to the level of the reference and ramps an integrator voltage up or down to suit. The integrator drives a homemade voltage-controlled resistor (VCR), U2, in the top-left corner of this circuit fragment to adjust the feedback resistance of the op-amp U3B.
3.2.3.2 HomeMade Voltage Controlled Resistor (VCR)
I built a voltage-dependant resistance using a small light bulb and a photocell pushed into opposite ends of a small tube. I used a 1″ piece of automotive brake line for the tube. Then hot-glued the ends shut and painted it black. As shown below:
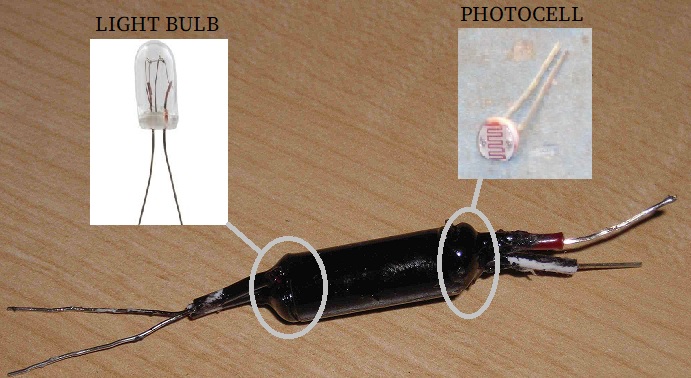
The lamp is a 6.3 V incandescent type 2180 by JKL. The photocell is a Cadmium Sulfide cell, whose measurement of the room-lit resistance was about 26K.
I also tried using an LED as the light source for the VDR but found it too non-linear to serve well in the gain loop of the generator. However, the light bulb was sufficiently linear and slow so that the feedback loop could settle in a second or two at most.
3.2.3.3 Stability Control
But I did find that the amplitude feedback system would change damping depending on the generated frequency. Low generated frequencies would settle to a constant amplitude quite well but the higher the frequency of oscillation the less stable it became until it would just do as the next picture (a) and oscillate the amplitude continuously.
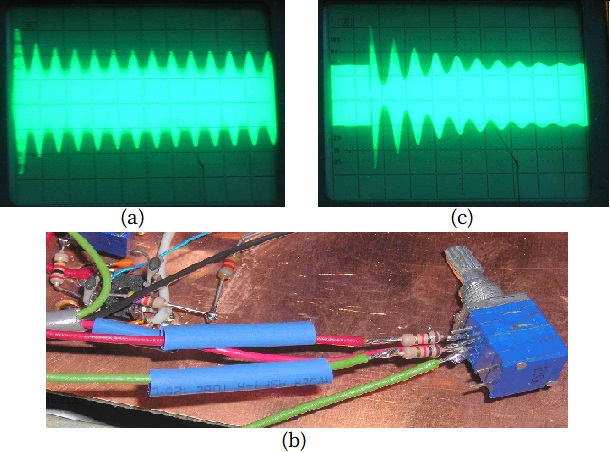
I found that adjusting the value of R26 (see top-right schematic in section 1) would allow the system to settle down after a second or so. It turns out that no automatic compromise could be reached at all frequencies of oscillation so I broke down after over a week of head-beating and put a small pot (b) on the front panel and called it “Stability”. With this I can adjust for a stable 4V P-P at any frequency.
Figure above (c) is showing damping of output level when “stability” control is just adjusted to be marginally OK. Note the pot labelled “Damping Trim” on the above AGC schematic fragment is practically irrelevant.
3.2.4 Output Attenuator
3.2.4.1 The Maths
This is based on the switched-PI attenuator concept:
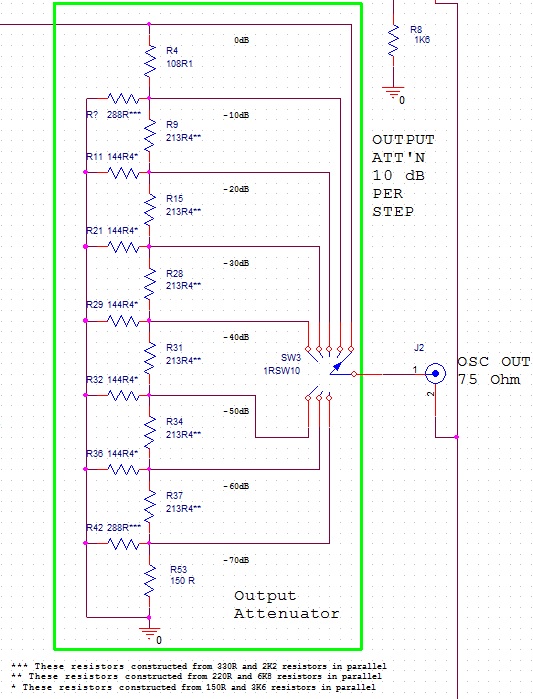
If this looks weird, know that this attenuator must satisfy several constraints:
1 – each position of the switch must present signal 10 dB bigger/smaller than the next,
2 – the impedance of the network looking toward the generator (up the string) from the connector must be 150 Ohms at any position of the switch,
3 – the impedance of the network looking toward ground (down the string) from the connector must be 150 Ohms at any position of the switch.
Points 2 and 3 above mean that the impedance looking into the connector is always 75 Ohms so will properly terminate a 75 Ohm cable. Such a cable properly terminated at the far end with 75 Ohms also will look like a 75 Ohm load at the connector. More info on source/load matching can be found here.
Solving this requires solving three simultaneous equations to find three resistor values for each section of the attenuation chain. Best done with something like MathCad (what I used) or MatLab or something else. When all of these constraints are met, then the attenuator has eight positions all 10 dB apart and all perfectly matched to a 75 Ohm cable.
Also, notice that there is NO buffer or simple amplifier between the oscillator, including its power buffer U4, and the attenuator. Any such thing would introduce distortion and that’s the thing I’m trying to avoid.
3.2.4.2 The Switch
The switch deck I used for the attenuator was a 2P5T switch that I reworked to be a 1P9T switch. Next picture shows the attenuation switch built up with some of the resistors. The blob of epoxy hides a crack in the wafer. Note that to get better than 1% accuracy in the resistors I used two selected 5% ‘ers in parallel. Every value was measured with a 4-digit Ohmmeter.
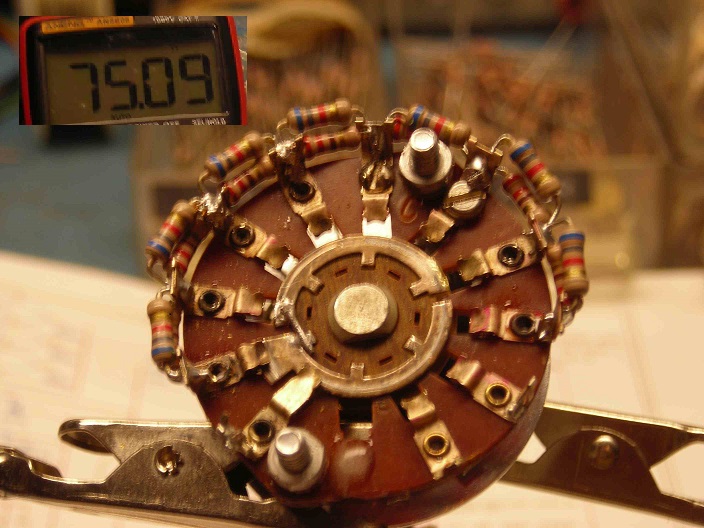
The output impedance was checked with Ohmmeter at each switch position.
3.2.4.3 Attenuator Results
When installed, the attenuation is checked on the spectrum analyzer. This is the difference between two switch positions three clicks apart:
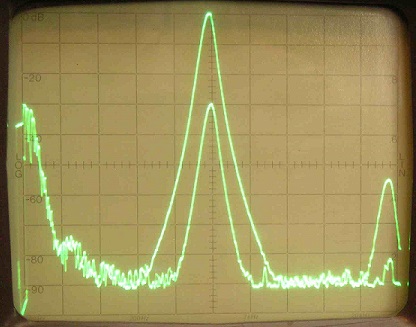
Vertical scale is 10 dB/cm. The SA will store one sweep while showing another, thus two sweeps can be compared.
3.2.5 Sync Output
This is a 1Vpp square wave of the same frequency as the generator:

It can be used to connect to a counter for frequency monitoring without regard to the attenuator setting.
3.2.6 Power Supply
Next picture shows the schematics of the power supply using Heathkits’ original transformer:
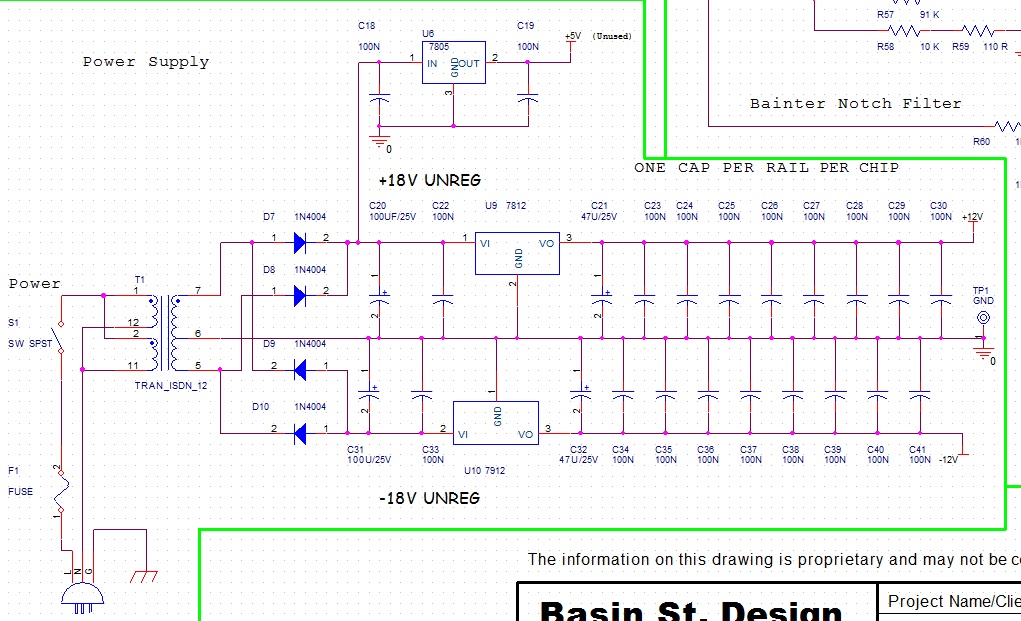
Pretty straightforward stuff with 78XX regulators (7805, 7812 y 7912). The built power supply can be observed as the green board of the second picture in section 3.1.
4. Low Distortion Audio Oscillator Performance
4.1 Initial Results
So how does it do? Here is 3778 Hz on the spectrum analyzer showing 90 dBs of clean harmonic-free tone:
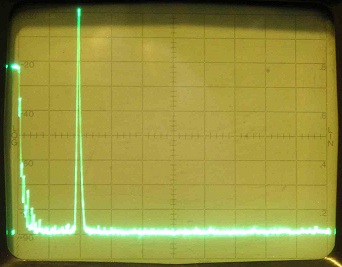
0 Hz is at the leftmost graticule line and scale is 2 KHz/div horizontally, 10 dB/div vertically. The peak at the left side of the screen is an artifact of the analyzers filters. Since the resolution BW dialed up (top-left knob) is 30 Hz then a peak about that wide is to be seen at the left. This artifact is documented in the service manual for the instrument and is unavoidable.
But as long as we decrease frequency, power line harmonics appear and become more obnoxious.
4.2 Power Line Harmonic Corruption
4.2.1 Description of the Problem
Here is some power line energy leaking into the spectrum analyzer and which must be tracked down and dealt with:
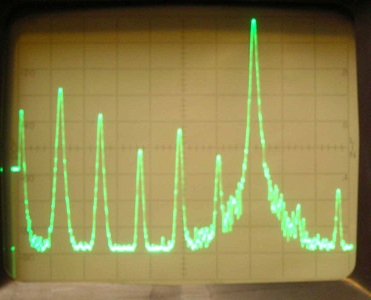
Scale is 0 Hz at left edge, 50 Hz/div to the right, 0 dBV at top line, 10 dB /div vertically. The tall peak is my signal generated with my home-built low-distortion audio oscillator at 360 Hz. The 60 Hz power line and harmonics can also be observed.
4.2.2 A “Grounding” Issue
I assumed that 60 Hz power line energy was coming from some element inside the generator box. In fact, I thought I confirmed that when the spectrum analyzer showed just the same power harmonic signature on the +12V rail. But I also found it on several other spots on the circuit. Just for grins, I wanted to see it disappear when I turned the oscillator unit off. But it didn’t. (Huh, ??) So I started powering down other things, one by one:
– the Oscilloscope where the output of the oscillator was also plugged into => no change,
– my frequency counter => no change,
– the lights, soldering iron, radio => no change.
I pulled the cable out of the SA and it finally disappeared. I was glad that the spectrum analyzer didn’t have THAT as a flaw. Then put it back and started disconnecting the coax from the other stuff and found that the power line corruption disappeared only when the coax was disconnected from EVERYTHING else. In fact it would come back if the GROUND side of the coax touched ANY “grounded” object, like a BNC connector, the soldering iron tip, the power strip shell, ANYTHING. Obviously there was a small voltage difference around a “ground loop” being formed between various bits of gear when two or more “grounded” points were connected and this caused some residual current around the loop.
4.2.3 A Partial Solution
Some time ago I characterized a classic bit of professional-quality audio gear being an audio input transformer. This thing is used to eliminate just this kind of problem in radio/tv stations, etc. Here is a report I filed on it.
So I used it here on the front end of the spectrum analyzer. It eliminated the ground loop almost completely. This shot shows that it is mostly gone:
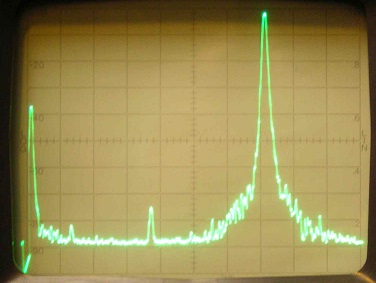
But it has its drawbacks: It introduces its own distortion products, especially at low frequencies. So, while it has proven that the 60 Hz corruption was not generated by my oscillator, it cannot be used to measure the distortion of my signals at the levels I am looking for. And it cannot be used to measure distortion at very low frequencies.
4.3 Distortion
4.3.1 Tunable Notch Filter
The second issue is building a workable tuneable notch filter to pass the signal through prior to inputting it into the spectrum analyzer (SA). This is needed to suppress the fundamental of the generated signal so that it will not overdrive the input circuits of the SA. This allows the input sensitivity of the SA to be cranked up so that the distortion products below the display floor can be brought up into view.
Several notch filter topologies were considered: the famous twin-T circuit, the Fliege circuit and the Bainter circuit.
4.3.1.1 Twin-T Circuit
The twin-T circuit has been analyzed many times. It is hardly tuneable. Tuning can be accomplished only by varying three resistors in close synchronism and as I’ve said before 3 pots on one shaft are terrible for that. And while it theoretically can have a VERY deep notch, the deepness and Q of that notch are drastically degraded with small variations of component values due to tolerances or drifts. So I do not choose this one.
4.3.1.2 Fliege Circuit
I analyzed this and while the notch frequency and Q are adjustable with single elements, not 2 or 3 on one shaft, it cannot have independent notch frequency and Q adjustments. Cranking one will affect the other. The Fliege requires use of a variable cap for frequency adjustment, so is another circuit which is easily designed for a fixed frequency, but not so much for a variable one.
4.3.1.3 Bainter Circuit
In this circuit both frequency and Q are adjustable with single pots as I mathematically showed in this link. It doesn’t make a notch as deep as the twin-T purports to (but then again no circuit will with real-world components that are not matched to much better than 1%) but does to a degree that is useful to me, about 50 – 60 dB. That is enough to allow a good measurement of the residual distortion products in my sinewave generator.
For a full report on the analysis and implementation of the Bainter Notch Filter, please visit this link.
4.3.2 Spectrum Analyzer Resolution
This shot is just to show how sensitive this old gem of a spectrum analyzer is:
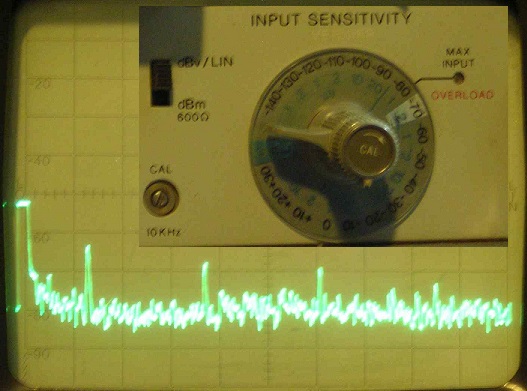
The input is shorted with a 75 Ohm cable terminator and no signal input. Span is 0-500 Hz. Notice that the input attenuation is at -70 dBV. That is the reference level at the top line of the screen. Counting down the screen from there 10 dB/div we get to a noise floor of -150 dBV and some residual power line crap (60 Hz, 180 Hz, 300 Hz) at -134 and -138 dBV. The scan took 1000 seconds to do at 1 Hz resolution bandwitdh, about 16 min.
Note “dBV” stands for “decibels referenced to 1V rms” so -150 dBV is about 32 nano-Volts rms.
4.3.3 Measurements
4.3.3.1 Distortion at 800 Hz
So, at long last we are in a position to find out just how good a sine oscillator the box is. This shows an 800 Hz tone:
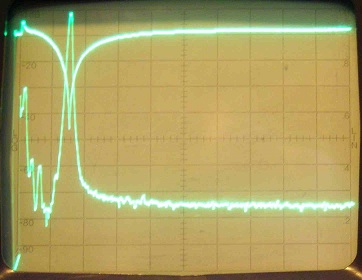
The horizontal scale is 0 – 5 KHz. The noise floor looks high because the resolution bandwidth is 30 Hz. It would be lower with a smaller resolution bandwidth but this is good enough for now and allows a quicker sweep speed. I have overlaid the response of the notch filter and tuned it to be at 800 Hz, too.
Next I put the signal through the notch filter to suppress the fundamental and allow the input sensitivity of the spectrum analyzer to be cranked up so that distortion products can be raised above the noise floor.
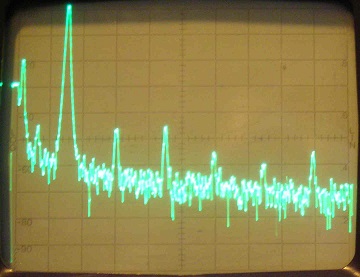
This is the same 800 Hz signal with the fundamental suppressed by about 60 dB and input sensitivity of the spectrum turned up by the same amount. All other settings remain the same. You can see that the noise floor has not moved appreciably but the 800 Hz harmonics have risen up. The tallest is the 3rd harm at -105 dBc (0.00056% or 5.6 ppm), 2nd at -106 dBc, 4th at -115 dBc, etc.
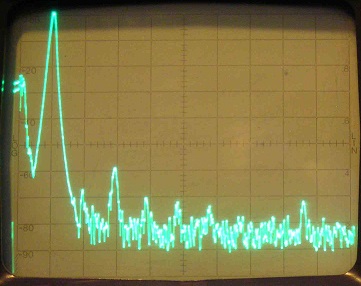
4.3.3.2 Distortion at 1 KHz
This is the same exercise for 1 KHz:
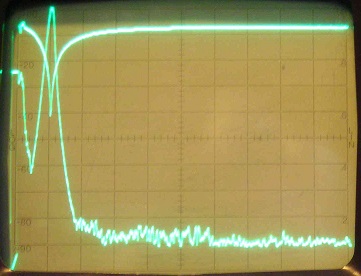
And 3rd harmonic is at -40 -59 = -99 dBc, also known as 0.0011% or 11 ppm:
5. Conclusions on the Low Distortion Audio Oscillator
I developed an audio Wien-Bridge oscillator and measured its distortion. Alongside the document I have spared you several measurements at various frequencies. The best distortion I’ve seen is -115 dBc (0.00018% or 1.8 ppm) but it gets a little worse at lower frequencies below 50 Hz because the time constants in the AGC look short at those frequencies so the amplitude correction mechanism shakes the gain a bit causing some distortion. At frequencies above 2 KHz it seems to be consistent at -99 dB.
I’m going to leave it here. I think what I have is about the best I can do without completely changing the philosophy of the machine. (Can you say “Direct Digital Synthesis”? ) And I guess it’s good enough for whatever audio stuff I will build in the foreseeable (and not so foreseeable) future.
About the author:
B. Ap. Sci. (EE), 1977 University of Waterloo, engineer, entrepreneur, retired.
Subscription
If you liked this contribution, feel free to subscribe to our newsletter:
