Nowadays, in any technical work of a certain level, it is common to program and simulate codes in mathematical simulators such as Matlab, or its free “equivalent” Octave. Typically the results of these simulations can be part of documents, presentations and meetings. On many occasions we could benefit from motion graphics to better visualize, explain and convey our conclusions. Consequently, knowing how to create GIF files in Octave and Matlab can play an important role here.
The text is organized with the following table of contents:
1. GIF Files
In short, a GIF file can be thought of as a set of image files that play in a loop. If these images are selected to have a continuity effect, a GIF file can be as effective as a video in conveying the evolution or movement of, for example, a graph or function. However, whether for simplicity, convenience, or lack of knowledge, such effects are not often seen in technical presentations.
This post is intended to help readers incorporate “motion” and “evolution” into their simulations quickly and efficiently. For this purpose, a simple code is shown that allows to concatenate figures and plots of results in the same GIF file.
2. Create GIF files in Octave
2.1 Code to create GIF files in Octave
The code to generate a GIF composed of several plots in Octave is shown, commented and explained below. In this particular example the function x^n is concatenated for several values of n in the interval x from 0 to 1.
% Code to generate a GIF composed of several plots in Octave
% In this example we concatenate the function x^n for several values of n.
% In the interval of x from 0 to 1.
x = 0:0.01:1;

% Properties of the .GIF file to be generated
% Name
filename = 'electroagenda.gif';
% Time in seconds for each plot in the GIF
DelayTime = 0.5;

% Create empty figure and assign number
f = figure;

% Function and GIF file update loop
for n = 1:0.5:5

      % Generate the function (x^n) and plot it
      y = x.^n;
      plot(x,y)
      title( 'www.electroagenda.com' , "fontsize", 16)
      drawnow

      % Image Processing
      % Assign plot to a frame
      frame = getframe(f);
      % Convert frame to RGB image (3 dimensional)
      im = frame2im(frame);
      % Transform RGB samples to 1 dimension with a color map "cm".
      [imind,cm] = rgb2ind(im);
      if n == 1;
          % Create GIF file
          imwrite(imind,cm,filename,'gif','DelayTime', DelayTime , 'Compression' , 'lzw');
      else
          % Add each new plot to GIF
          imwrite(imind,cm,filename,'gif','WriteMode','append','DelayTime', DelayTime , 'Compression' , 'lzw');
      end
end
It is important to note that the ‘Compression‘ and ‘lzw‘ tags on lines 33 and 36 are necessary so that the resulting file is compressed and takes up less space.
2.2 Results
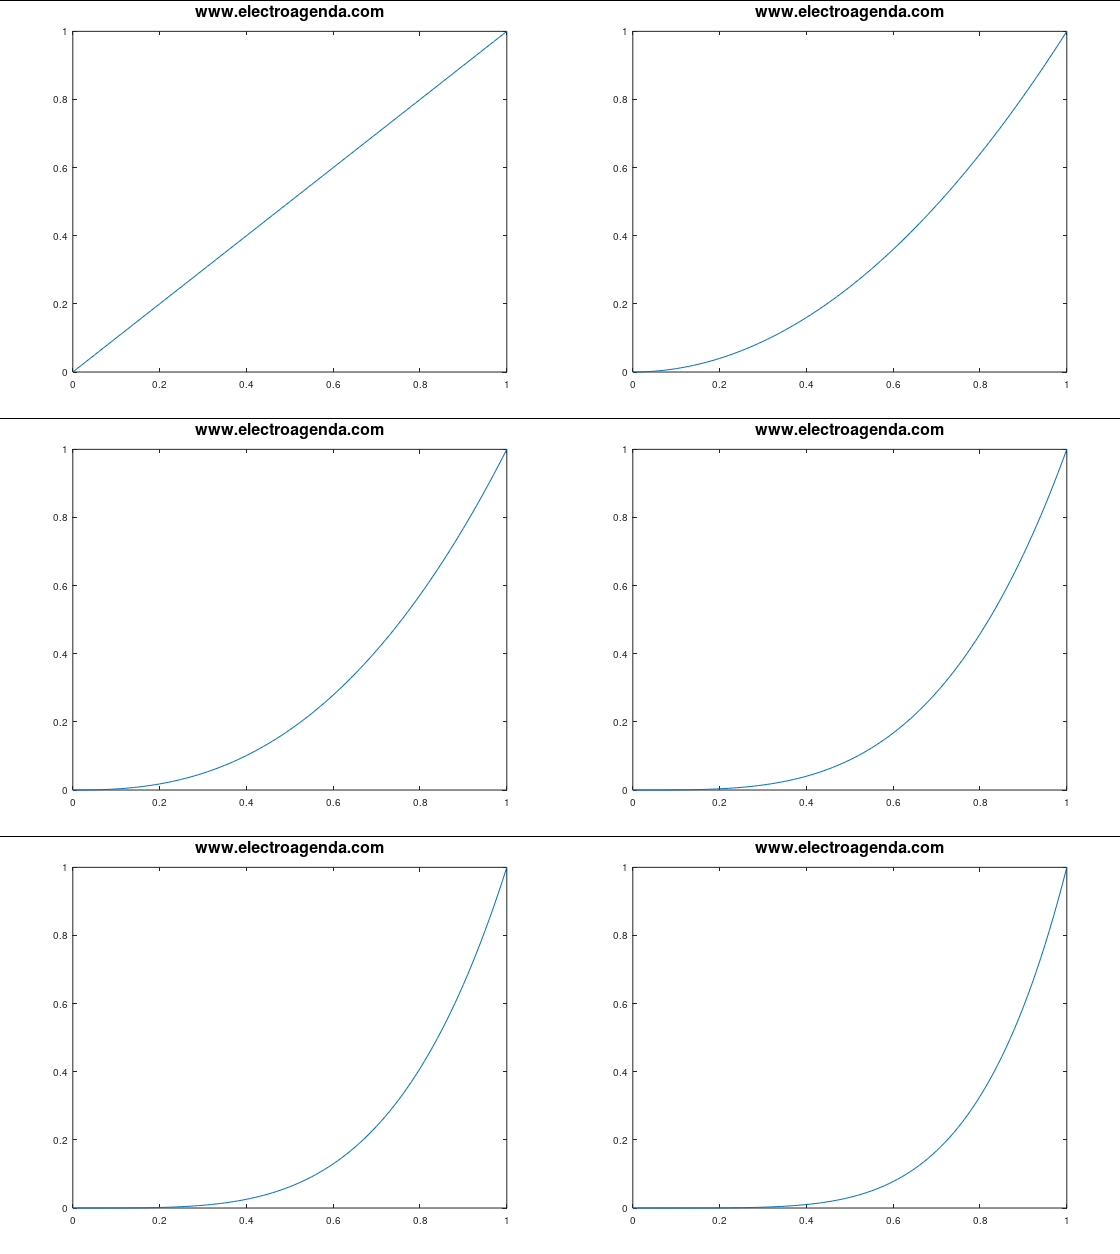
In line with the previous section, the code shown was executed in Octave version 5.2.0 obtaining the following result in the file ‘electroagenda.gif‘:

Thus, it is clear that the proposed code allows the creation of GIF files in Octave, concatenating the desired plots or figures.
3. Create GIF files in Matlab
3.1 Code to create GIF files in Matlab
Below is the equivalent code in Matlab for the same example performed in Octave in the previous section.
% Code to generate a GIF composed of several plots in Matlab
% In this example we concatenate the function x^n for several values of n.
% In the interval of x from 0 to 1.
x = 0:0.01:1;

% Properties of the .GIF file to be generated
% Name
filename = 'electroagenda.gif';
% Time in seconds for each plot in the GIF
DelayTime = 0.5;

% Create empty figure and assign number
f = figure;

% Function and GIF file update loop
for n = 1:0.5:5

      % Generate the function (x^n) and plot it
      y = x.^n;
      plot(x,y)
      title( 'www.electroagenda.com' , 'fontsize' , 16)
      drawnow

      % Image Processing
      % Assign plot to a frame
      frame = getframe(f);
      % Convert frame to RGB image (3 dimensional)
      im = frame2im(frame);
      % Transform RGB samples to 1 dimension with a color map "cm".
      [imind,cm] = rgb2ind(im , 256);
      if n == 1;
          % Create GIF file
          imwrite(imind,cm,filename,'gif','DelayTime', DelayTime , 'LoopCount' , Inf );
      else
          % Add each new plot to GIF
          imwrite(imind,cm,filename,'gif','WriteMode','append','DelayTime', DelayTime );
      end
end
The differences with the Octave code are the following:
- On line 21 the ‘fontsize‘ tag cannot be enclosed in quotes.
- The rgb2ind function in Matlab (line 30) requires another argument to specify the color map. In this case an additional argument with the number 256 has been added.
- Unlike Octave, it is necessary to include the directive ‘LoopCount‘ equal to ‘Inf‘ on line 33 to ensure that the loop repeats constantly.
- In lines 33 and 36, the references to compression have disappeared. This is because the imwrite function already performs the compression in Matlab without requiring additional tags.
3.2 Results
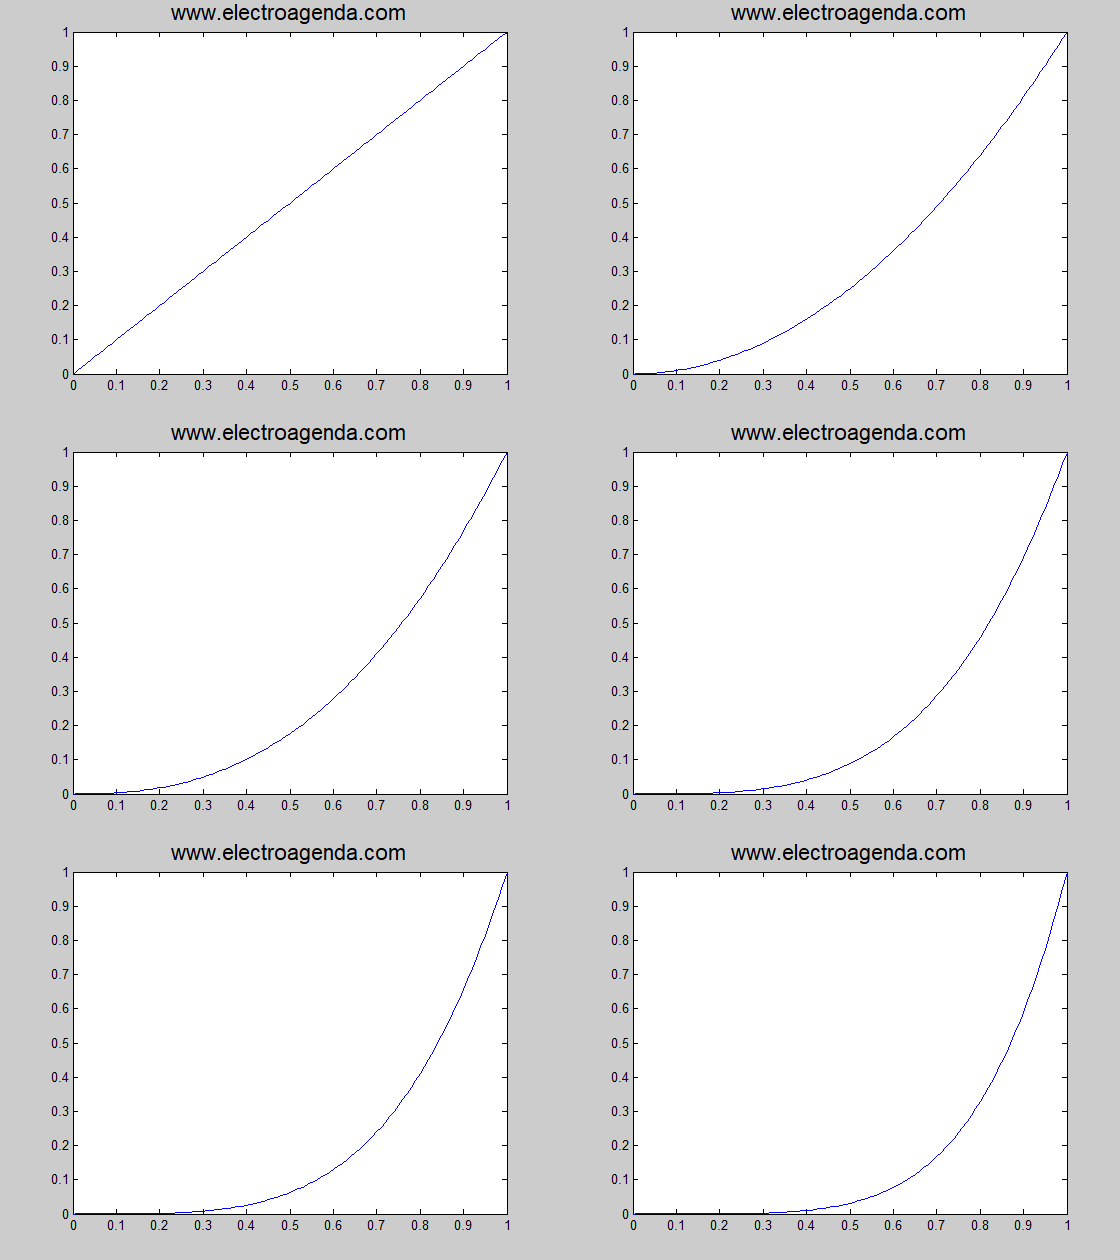
In line with the previous section, the code shown was executed in Matlab versión 7.9 (R2009b) obtaining the following result in the file ‘electroagenda.gif‘:

Thus, it is clear that the proposed code allows the creation of GIF files in Matlab, concatenating the desired plots or figures.
3.3 Modern Versions of MATLAB
Starting with MATLAB R2022a, the exportgraphics function is incorporated, which can be used to create GIF files more easily as shown below:
x = 0:0.01:1;
filename = 'electroagenda.gif';
f = figure;
for n = 1:0.5:5
    y = x.^n;
    plot(x,y)
    title('www.electroagenda.com','fontsize', 16)
    exportgraphics(f,filename,append=true)
end
However, this method does not allow to specify the framerate, so it is still preferable to use the traditional code explained above. Note that such code can now be optimized by avoiding calling the plot function at each iteration, as described in this link.
Finally, from MATLAB R2023b it is possible to create animations from scripts, which can then be exported to GIF files. Such methodology is shown in this link.
4. Conclusions
This article shows how to create GIF files in Octave and Matlab by concatenating several plots simulated with these tools. This allows us to add motion and evolution effects to our analyses. In this way, results can be more easily understood and presentations to colleagues or clients can be improved.
On the other hand, it is clear that the compatibility between Octave and Matlab code, although high, is not absolute. In complex and casuistic functions, such as those used in this article, there are small differences that require a slight modification of the code to obtain equivalent results.
Besides, it should be added the differences due to the various versions of Octave and Matlab. In this case the code has been tested only in one version for each tool. Readers are encouraged to indicate the compatibility of the proposed code in other versions of Octave and Matlab and to report it in this link. In any case, the latest version of Matlab can be tested for free on the MATLAB Online platform.
Subscription
If you liked this contribution, feel free to subscribe to our newsletter:
