Nonlinear distortion is a phenomenon that can occur when a signal passes through a nonlinear transmission medium or electronic component. This phenomenon consists in the appearance in the output signal of frequency components that were not present in the original signal. It is often caused by saturation of the maximum amplitude value in the output signal.
Mathematical Model
As a starting point, it should be noted that signals can be decomposed into a sum of tones of amplitude A, frequency f, and phase \footnotesize \varphi [1]. Therefore, at the input of a medium or component, a generic signal \footnotesize s_{in}(t) composed of N tones would be expressed as follows:
\begin{equation} s_{in}(t) = \sum_{i=1}^N{A_i}\cos(2{\pi}f_it\,+\,\varphi_i)\qquad i=1,2,3….,N \end{equation}
Linear Transmission
In a linear transmission medium, no new frequencies are generated in the output signal \footnotesize s_{out}(t) with respect to the input signal \footnotesize s_{in}(t) . However, each of the frequency components of the input signal can be affected in amplitude and phase. Mathematically:
\begin{equation} s_{out}(t) = \sum_{i=1}^N{G_i}{A_i}\cos(2{\pi}f_it\,+\,\varphi_i\,+\,\varTheta_i)\qquad i=1,2,3….,N \end{equation}
Where \footnotesize G_i represents the effects of the medium or component on the amplitude of each frequency component. And \footnotesize \varTheta_i symbolizes the phase shifts introduced for each frequency component.
Depending on the values of \footnotesize G_i and \footnotesize \varTheta_i amplitude distortion and/or phase distortion may or may not occur.
NonLinear Transmission
Definition
A NONlinear transmission medium or electronic component can simultaneously produce the following effects on the input signal \footnotesize s_{in}(t) :
- Gain \footnotesize G_i and Phase Shift \footnotesize \varTheta_i on the input frequency components, as in a linear transmission.
- Generation of new tones at frequencies that already existed in the input signal. The effect is the same as the previous point.
- Generation of new frequency components that did not exist in the input signal.
Combining all these effects the output signal has the following mathematical expression:
\begin{equation} s_{out}(t) = \sum_{i=1}^N{G_i}{A_i}\cos(2{\pi}f_it\,+\,\varphi_i\,+\,\varTheta_i) + \sum_{k=N+1}^M{A_k}\cos(2{\pi}f_kt\,+\,\varphi_k) \end{equation}
The appearance of new frequency components means that the output signal changes its appearance. In other words, a nonlinear effect always results in nonlinear distortion.
Example: NonLinear Saturation Distortion
Often, for example in amplifiers, nonlinear distortion occurs due to amplitude saturation of the output signal.
For example, suppose an amplifier that has a gain G for an input signal \footnotesize s_{in}(t) . However, due to design considerations, all amplifiers have a maximum value \footnotesize S_{max} for the output signal \footnotesize s_{out}(t) . Mathematically:
\begin{equation} s_{out}(t) = min(Gs_{in}(t),S_{max}) \end{equation}
Note that equation (4) represents a simplification with respect to a real amplifier. Firstly, a saturation does not occur in such an abrupt way, but there is a compression typically represented by a polynomial. Secondly, equation (4) only saturates the positive value of the signal, whereas in a real amplifier the saturation affects both positive and negative values. Nevertheless, we use equation (4) because it allows us to illustrate in a simple and valid way the concept of nonlinear distortion by saturation, as shown in the following figure.
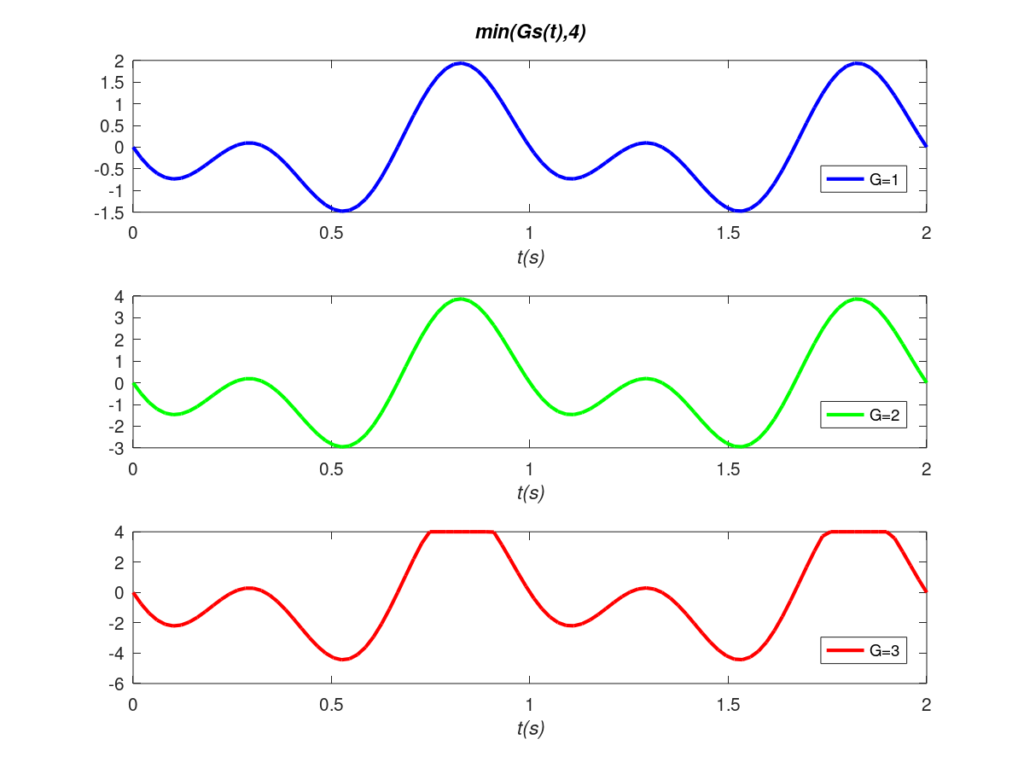
The blue signal represents the input signal. When the gain is not sufficient to saturate the input signal, linear transmission occurs without distortion as seen in the green signal. Conversely, when the gain is sufficient to saturate the signal, nonlinear distortion is produced by the steps seen in the red signal. These abrupt and rapid transitions result in new components with higher frequencies that were not in the original signal. This is why spectral analysis also makes it easy to identify nonlinear distortion.
Bibliography
[1] Communication Systems, A. Bruce Carlson.
Subscription
If you liked this contribution, feel free to subscribe to our newsletter: