The prefix Qucs (Quite Universal Circuit Simulator) refers to a family of electronic circuit simulators that can be used for free: Qucs Original, Qucs-S and QucsStudio. All variants have a very powerful and effective graphical interface, which is even better designed than that of other paid tools. This makes this simulator very attractive for all types of users, both for amateurs and in professional environments.
This article focuses on the most ambitious variant, called QucsStudio, and reviews all its design and simulation possibilities. The detailed concepts and images shown below are mostly taken from QucsStudio’s own web site, from its example projects, or from its demonstration videos.
The content is organized as follows:
1. Context: Qucs and Variants
This section briefly develops the history of the original Qucs and its evolutions, Qucs-S and QucsStudio.
1.1 Original Qucs
Qucs was originally developed by Stefan Jahn and Michael Margraf among others. Its original goal is to become a full electronic circuit simulator, including typical SPICE simulations (DC, AC, transient) and also those of RF design (S-parameters, Harmonic Balance).
The two main features of Qucs are the following. First, it uses its own simulation engine, Qucsator, which is different from SPICE. It also has a very well designed graphical interface, based on Qt, which provides a very comfortable and effective user interface.
1.2 Qucs-S
Qucs-S (also referred to as Qucs with Spice) extends the original Qucs and allows to use, in addition to Qucsator, free simulation engines based on SPICE (Ngspice, XYCE, SpiceOPus). Its main developers are Vadim Kusnetsov and Mike Brinson.
1.3 QucsStudio
QucsStudio is another circuit simulator that has evolved from the original Qucs project. Developed independently by Michael Margraf, QucsStudio introduces a new simulation engine and adds unique features not present in the other variants such as system simulation, electromagnetic simulation of PCBs, or integration with C/C++, Octave and Kicad.
In practice QucsStudio is the most ambitious version of all those mentioned, with many possibilities for professional use, at least in small environments. The following is an overview of the different types of projects, simulations and co-simulations that can be performed.
2. Graphic Interface in QucsStudio
The following image shows an example of QucsStudio’s graphical interface. The picture shows several sections that are summarized in this section.
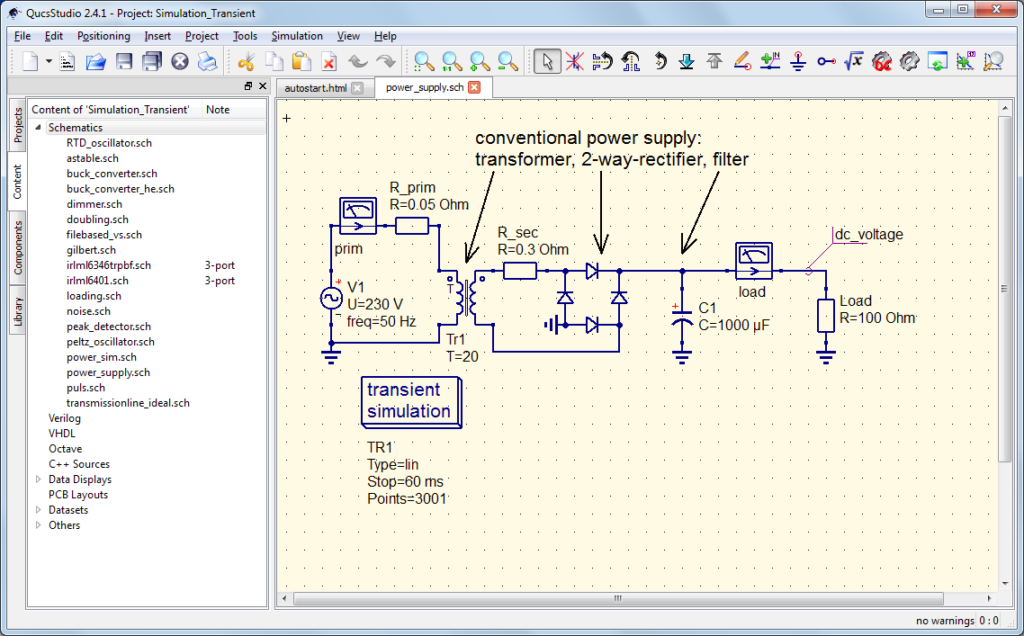
As usual, the top horizontal part contains the various menus for operating the tool. Shortcuts to the most frequently used functions (save, launch simulation, move up/down in the subcircuit hierarchy, etc.) are also displayed.
In the left part, vertically, you can select one of the following tabs. The “Projects” tab shows all projects in the working path. The “content” tab shows all simulation files: schematics, codes (VHDL, verilog, C/C++, Octave), results (data and .dpl displays), files with PCBs and others as .html files (see section 6). Next, the “components” tab includes the various generic elements and controllers that can be included in the schematics for the different types of simulation. Finally, the library tab includes specific components from different manufacturers.
In the central part, occupying most of the screen, you can display any of the files mentioned in the previous paragraph for the “Contents” tab. Specifically, in the example of the image, the schematic of a circuit on which a transient simulation is configured is shown. In the schematics, multiple blocks at different hierarchy levels can be made and easily navigated through. The following video shows an introductory simulation of QucsStudio and the navigation through subcircuits at different levels:
Next, during the explanation of the different possibilities of use of QucsStudio, more images and videos are shown that allow you to visualize more details and possibilities of its graphical interface. In addition, section 5 also details the possibilities of the tool to display results.
3. Electronic Design with QucsStudio
The design and simulation of electronic circuits with QucStudio is based on several types of analysis. The controllers for all possible types of analysis are included in the schematic from the “simulations” menu under the “components” tab. They are shown in the following graphic:

The following are the possible types of circuit analysis divided into three sections: analog (including RF), digital and system.
3.1 Analog Circuit Design in QucsStudio
This section shows the extensive analog circuit design and simulation capabilities of QucsStudio. By including support for S-parameters and harmonic balance, QucsStudio extends its possibilities from analog design to RF electronics design.
In addition, in QucsStudio there are several utilities that can be used to support analog and RF circuit design. These are the following tools (described in more detail below in section 6): inductive and capacitive component designer, transmission line synthesis, automatic filter design, impedance matching and attenuator calculation.
3.1.1 Components
The following image shows the different components that can be used in these simulations including also the component library sections, where you can select specific components with their manufacturers’ references.
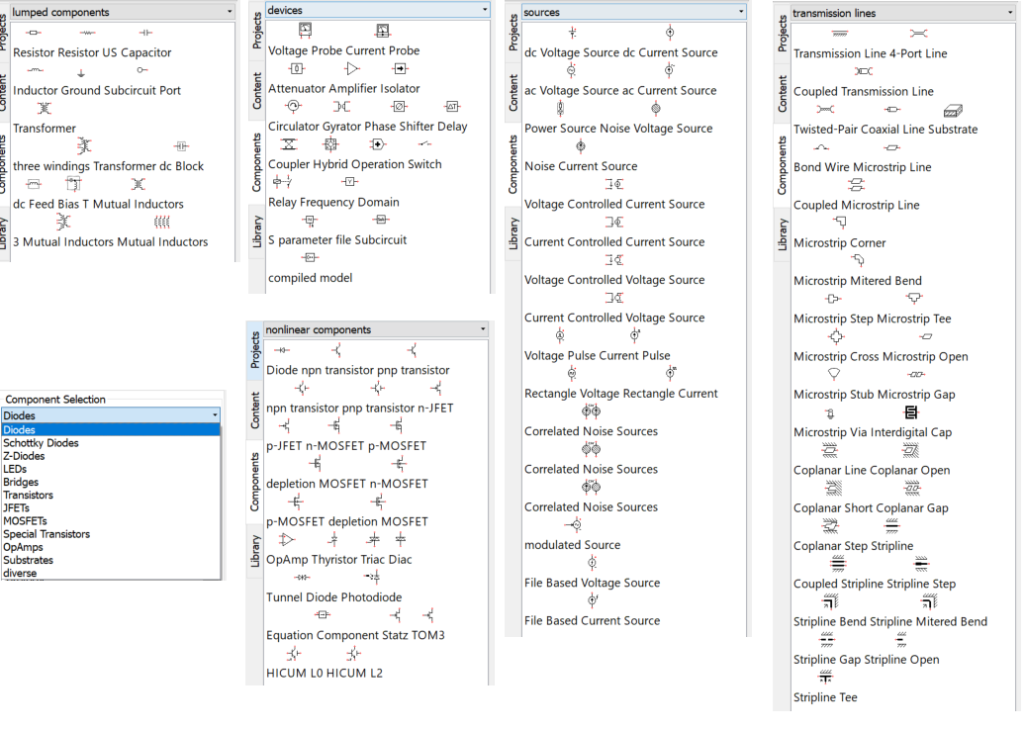
Components from other tabs, such as digital or system elements may also be modeled to work in analog simulations. Moreover, for the inclusion of components imported from SPICE or defined/modeled with equations or in C/C++ and VerilogA files, see section 4 below.
3.1.2 Simulations
The types of analysis that can be performed on an analog schematic are explained below. In all cases a parameter sweep can be performed, equivalent to automatically repeating an analysis with different values for the key parameters of the schematic.
3.1.2.1 DC Analysis
DC analysis allows to obtain the DC voltages and currents that polarize an analog circuit. It consists of a nonlinear steady-state analysis.
The following video shows a simple DC simulation:
3.1.2.2 AC Analysis
The AC analysis obtains the linear and steady-state behavior of the analog circuit at predetermined frequencies. Previously, and automatically, a DC analysis is performed to obtain the polarization of the nonlinear components.
The following video shows a simple simulation in AC:
In these simulations it is also possible to obtain the noise of the circuit, both in frequency and total contribution. The origin of the noise is noise sources inserted in the scheme plus the noise generated by the components themselves. In any case, only the linear noise contribution without frequency mixing is analyzed.
3.1.2.3 Transient
Transient analysis obatins the signal waveform at any point in a circuit. It is therefore a nonlinear analysis performed in the time domain. The controller can be configured to simulate a complete transient, or to provide the steady-state waveform.
The following video shows a simple transient simulation:
The transient analysis takes into account the noise of the components, in addition to the noise sources that are added in the scheme.
3.1.2.4 S-Parameters
This analysis allows to obtain the S parameters of the simulated stage. Like the AC analysis, it is a linear steady-state simulation performed in the frequency domain.
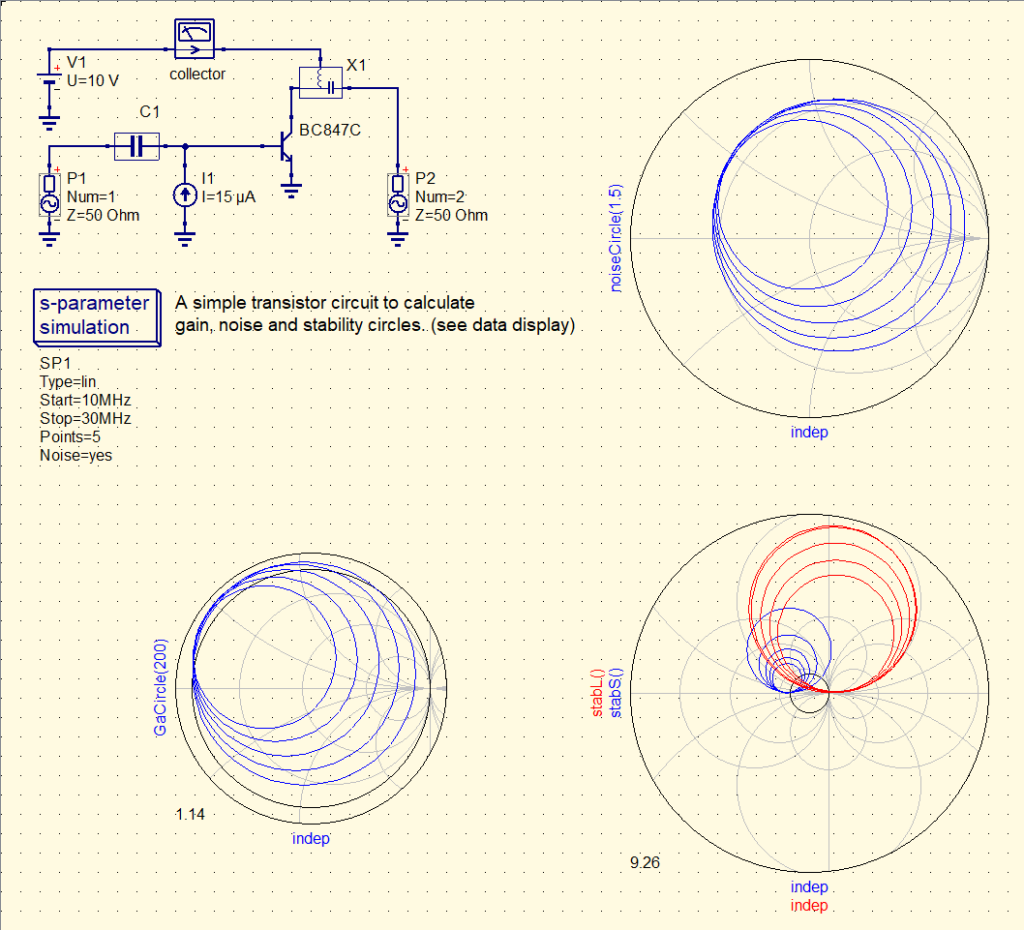
S-parameters from an external file can be integrated into the analysis to be embedded or de-embedded. The tool also incorporates the equations to automatically calculate the stability and maximum gain parameters as well as the stability, gain and noise figure curves.
The following image shows an S-parameter simulation with some of the above-mentioned results:
3.1.2.5 Harmonic Balance
This is a nonlinear analysis performed in the frequency domain. In this analysis, fundamental tones, their harmonics and their steady-state intermodulation products are obtained.
This way, large-signal equivalents can be obtained for AC and S-parameter simulations. In addition, QucsStudio incorporates predefined functions that allow the P1dB to be obtained automatically. For sufficiently high frequencies, the steady state of a circuit can be obtained more quickly with this strategy than with transient analysis.
The following video shows an example of a harmonic balance simulation:
In contrast to the AC noise analysis, the harmonic balance noise analysis also calculates the noise obtained by frequency mixing.
3.1.3 Circuit Tuning
In DC or S-parameter analysis it is common to modify the parameters of the circuit components in an attempt to meet a design condition. There is a very useful strategy to see how each particular component affects the simulation result. Specifically, this is tuning or fine tuning of values.
In this method, once the simulation has been defined, the parameters that can be changed and their dynamic range are indicated. Manually, each parameter can be modified with scroll bars. Simultaneously, you can see how the modification of each parameter affects the result of the simulation.
The following video shows a simple example of manual tuning:
3.1.4 Circuit Optimization
In many cases, circuit tuning is not enough because it is neither practical nor effective. This is mainly due to two reasons:
- First of all because there can be many parameters that can change. And looking for a minimum or a maximum manually in a function of many variables is very complex.
- On the other hand, because the optimization conditions can also be multiple affecting different results. Consequently, identifying the direction of change required for each parameter is not obvious.
For these occasions there is another functionality that optimizes circuits automatically. By indicating the parameters that can be changed, their dynamic range, the objective(s) to be achieved, and the working algorithm, the tool iterates with the parameters in an attempt to optimize the results.
The following video shows the optimization of a filter designed with stubs:
Finally, the following video shows the optimization of a diplexer based on discrete components:
3.1.5 Monte-Carlo Analysis
The Monte-Carlo method allows to extend any of the analyses of section 3.1.2 by taking into account the tolerance of the schematic elements.
In practice, multiple simulations are performed automatically. In each of them the parameters present a different value within their statistical distribution, either normal or uniform. Therefore it is possible to observe the variability of the simulation result depending on the tolerance of the circuit components.
The following example shows the Monte-Carlo simulation of a 6 dB pi attenuator:

3.1.6 PCB Support
QucsStudio supports PCB design at both production and simulation level. On the one hand it is integrated with KiCad circuit routing software. On the other hand it allows to perform electromagnetic simulations. These functionalities are explained below.
3.1.6.1 PCB Routing
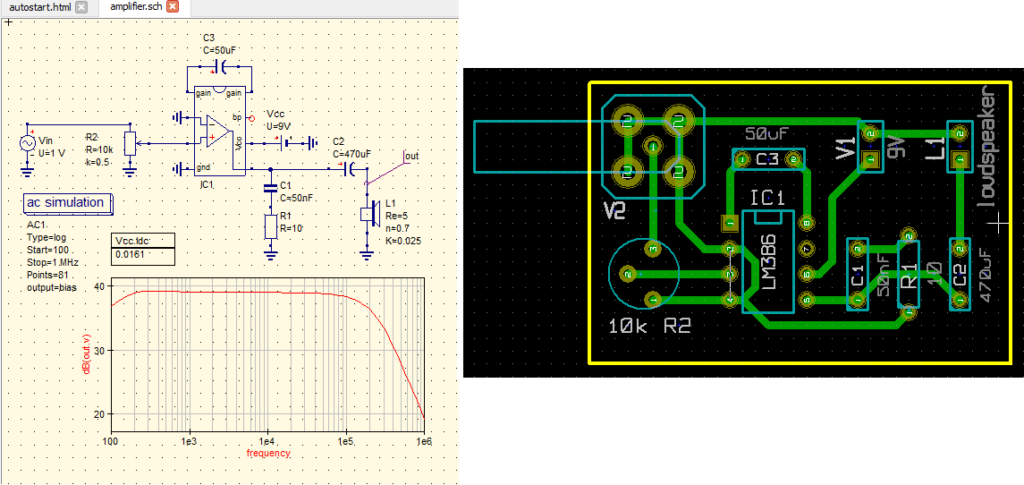
All schematic elements have a selectable footprint, sometimes with several options. Likewise, for components modeled by the user, their footprint can be added for use in routing. In this way, for each schematic, a simulation and a routing in KiCad can be available simultaneously. The following image shows an example:
3.1.6.2 Electro-Magnetic Simulation
QucsStudio also allows to analyze circuits based on microstrip lines by means of an electromagnetic field simulator. The method used is finite differences in the time domain.
Given a schematic composed of items from the “transmission lines” menu, the tool automatically generates the views using the “Create PCB layout” tool. The same S-parameter simulation driver and the same substrate defined in the schematic are used to simulate the tracks.
The following video illustrates how to perform electromagnetic simulations from a schematic:
There are other more sophisticated ways to create or import routings for electromagnetic simulation. For example, discrete elements such as capacitors or resistors can be incorporated into the simulation. It is also possible to directly create a layout without the need of an associated schematic. Finally, it is also possible to import routings from tools such as hyperlynx.
The following video shows examples including all the functionalities discussed in the previous paragraph:
3.2 Digital Circuit Design in QucsStudio
This section shows the possibilities of designing and simulating digital circuits in QucsStudio. After a brief review of the allowed components, it is explained how digital analysis and support for VHDL and Verilog description languages work.
3.2.1 Components
The following picture shows the different components that can be used in digital simulations. They are basically bit generators, logic gates, flip-flops and components defined in VHDL/Verilog:

Components defined in C/C++ files can also be included, as detailed in section 4.4 below.
Note that in this case there is no sense in applying the “nested sweep” component, nor can noise sources be incorporated, since strictly digital simulations are performed.
3.2.2 Digital Simulations
3.2.2.1 Simple Digital Circuits
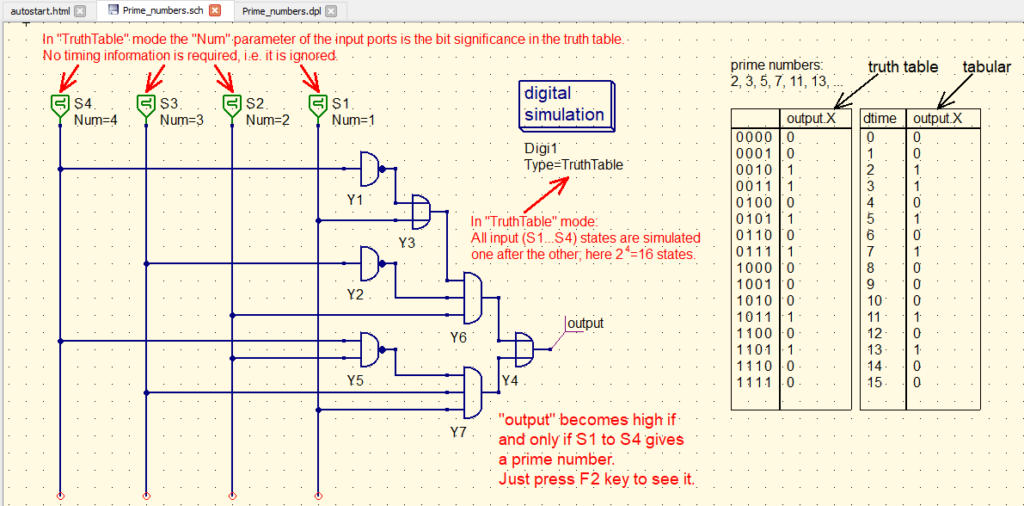
In its simplest variant, the simulation uses simple digital stimuli, either constant bits or bit sequences. From these stimuli, the analysis calculates either the truth table or the chronogram at the outputs, as shown in the following graphs:

3.2.2.2 VHDL / Verilog Support
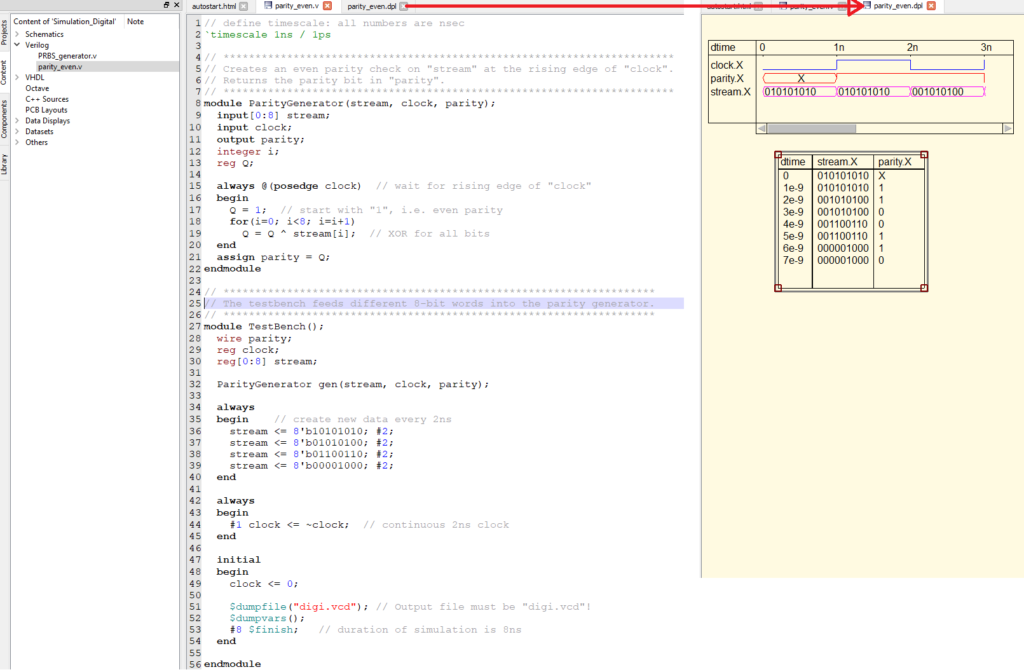
QucsStudio also interprets VDHL / Verilog files, which allows to increase the complexity of the simulated digital circuits. In this way it is possible to incorporate components whose behavior is described in VHDL/Verilog files to the schematic and simulate them together with the rest of the digital components using the graphical interface of the tool. As shown in the following image:

In addition, VHDL/Verilog files with their own testbench can also be simulated directly. In this case there is no graphical schematic of the circuit, since the simulation is described in a text file. However, the simulation results can be observed with the graphical interface of the tool. This methodology is reflected in the following image:
3.3 System Design at QucsStudio
This section shows the possibilities of designing and simulating systems in QucsStudio, including the most characteristic components and simulation parameters.
3.3.1 Components
The following graphic shows the components that can be used in schematic and system simulations:

It is clear that the application is very much oriented towards high-level simulation of communications systems, both electronic and opto-electronic. Logically, noise sources can also be added in this case. In addition, as in analog simulations, nested sweeps can be used so that multiple simulations of the system are performed automatically with the preselected parameter values.
Finally, it is also possible to include components defined in C/C++ files, as detailed in section 4.4 below.
3.3.2 System Simulation
System simulation employs the following concept: a block of complex numbers is sent to a component that processes them according to their function. Output data is then sent to all components with which it is connected. The procedure is repeated until it passes through all components.
The main application is the simulation of communications systems, where the complex number represents the complex envelope, i.e. the amplitude and phase of the carrier. Therefore, the simulation controller needs the following parameters:
- Rate: indicates the rate at which symbols are sent per second.
- Samples per symbol: together with the speed allows to derive the sampling rate of the simulation.
- Number of symbols: sets the total time range of the simulation.
In this way, time domain signals (constellations and eye diagrams) can be visualized and data error rates can be measured. The following example shows the simulation of an electro-optical system where the eye diagram in the receiver is represented as a function of key parameters:

4. Component Modeling in QucsStudio
The standard and specific components already included in QucsStudio have been mentioned in the previous section for the different types of simulations. In addition to these components, it is possible to add and define other components from different sources. This section explains the different mechanisms that can be used by the user to incorporate components into QucsStudio.
It starts by explaining the simple import of SPICE files. Then it is explained how to define linear and nonlinear components with equations. Finally, for the definition of complicated elements, modeling in VerilogA and C++ is explained.
Finally, it is important to point out that the user can create his own component libraries and integrate them into the platform as if they were native elements.
4.1 Import from SPICE
QucsStudio allows you to import elements from SPICE in several ways. The easiest mechanism is as simple as pressing the F2 key from a “.cir” file. The tool then automatically generates a schematic including circuits and subcircuits, components with predefined models (such as transistors), and simulation controllers.
In the following graph the mentioned procedure is shown:
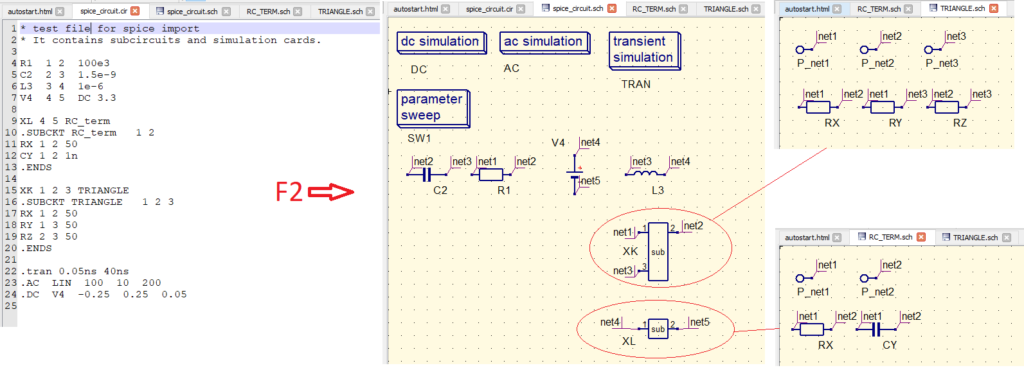
Obviously the components imported from SPICE are valid only for analog circuit simulations, as detailed in section 3.1 above.
4.2 Equations
QucsStudio incorporates several elements that allow defining both linear and nonlinear components in a generic way by means of equations. These are explained below.
4.2.1 Frequency Definition
The “Frequency Domain” component makes it possible to define a linear element by means of frequency-dependent parameters (S, Y, Z, H, G, A, T). Frequency dependence can be incorporated by means of the equations determining the transfer function in the Laplace domain. The elements defined in this way can be used in both analog and system simulations. The following example shows the flexibility of this strategy:

Note that the transfer function can also be defined using the variable “freq” as an independent variable when it is defined by the simulation controller, as in AC or S-parameter simulations:

4.2.2 Nonlinear Component
For non-linear modeling, the “Equation Component” is used. It consists of one or more ports related to each other. The key is that for each of the ports you can define equations for the current and load as a function of the voltages of any port. This is equivalent to defining the resistance and capacitance of each port. In this way nonlinear behavior can be modeled as shown in the following example:
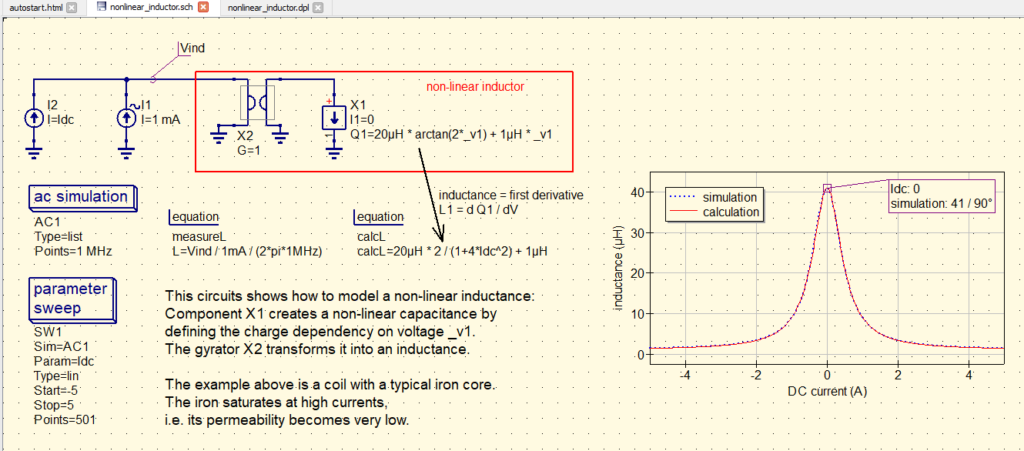
This element can be used in the analog simulations explained in section 3.1.
4.2.3 System Equation
Finally, the “Equation Component” can be used for the system simulations of section 3.3. This element allows you to define an equation as a function of your input signals and time. In this way, the desired behavior can be easily modeled.
4.3 Modeling with VerilogA
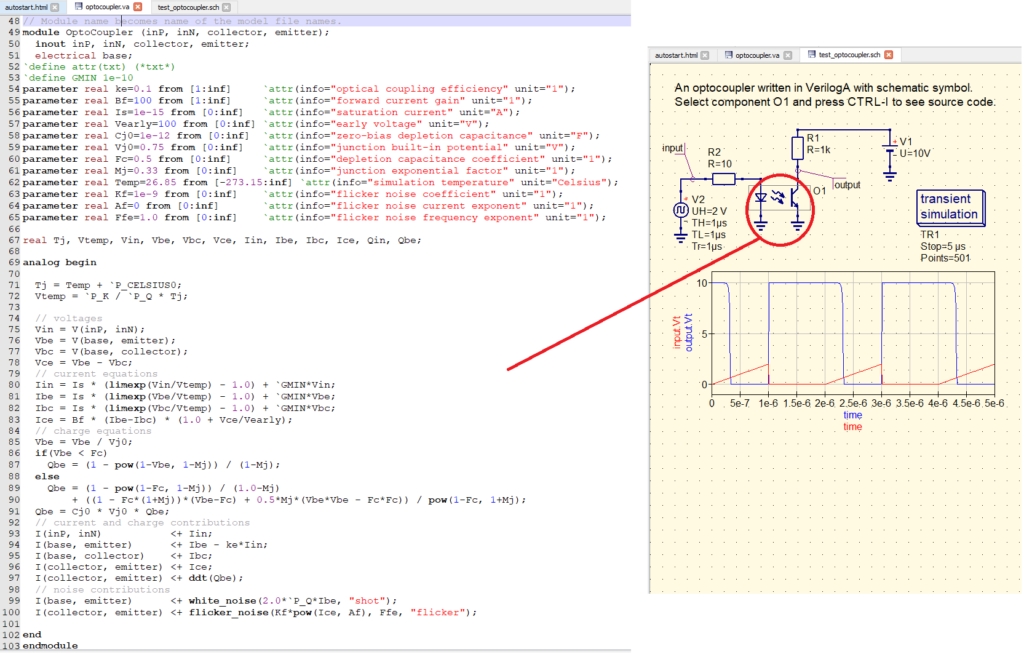
The modeling method mentioned above in section 4.2 may not be sufficient for complicated cases. Therefore QucsStudio includes support for the use of VerilogA, a programming language developed specifically for component modeling. VerilogA is a hardware description language that includes only the analog subset of Verilog-AMS instructions. Therefore, these models generated with VerilogA are valid for all analog simulations detailed in section 3.1.
The following image illustrates the simulation with a phototransistor modeled with VerilogA. The tool allows to assign a symbol to the element improving the visual aspect of the schematic.
4.4 Modeling with C/C++
The most comprehensive approach in QucsStudio for modeling components without limitations is to use C/C++. A single text file allows you to define the behavior of a component for all available simulation types:
- Analog: it is necessary to complete a function for the analog behavior and another for the noise. These functions define the circuit parameters between the different nodes defined in the component. As an example of analog model in C/C++ the following code from the QucsStudio template is shown:

- Systems: a function that specifies the output samples as a function of the input samples must be completed. The following code from the QucsStudio template is shown as an example of a C/C++ system model:

- Digital: in this case the description code (both VHDL and Verilog) must be included inside the C/C++ file. It is included in the file as a character type variable. As an example of a digital model in C/C++ the following code from the QucsStudio template is shown:

Additionally it is necessary to indicate in the file the rest of the information relevant to the simulator: global variables, component definition, symbol and icon, and input/output parameters mainly. Once the file is compiled, the component can be used in schematics in the same way as shown in the examples above.
5. Simulation Results
The presentation of simulation results in QucsStudio is very flexible and versatile, allowing also to post-process the results in several ways. This section briefly explains all these functionalities.
5.1 Results Diagrams
Depending on the type of simulation, it is convenient to use different types of graphics to present the results. QucsStudio allows representing data in the following formats: 2D and 3D Cartesian coordinates, polar coordinates, tabulated data, Smith diagrams (impedances and admittances), combined Smith and polar diagrams, locus curves, chronograms and truth tables for digital simulations, and, finally, eye diagrams for system simulations. The mentioned diagrams can be found as an additional component in the “Diagrams” menu under the “Components” tab, as shown in the following image:

As shown in many of the examples in this text, all diagrams can be included both in the data displays page and in the circuit schematic. The latter is very useful both visually for the user and for sharing schematic-results screenshots with colleagues.
5.2 Equations
Equations can be incorporated either in the diagrams themselves or directly in the graphical interface. In the latter case, the equations can respond directly to changes in the variables that make them up. In this way, interactive diagrams can be created to explain technical concepts, as shown in the following image:

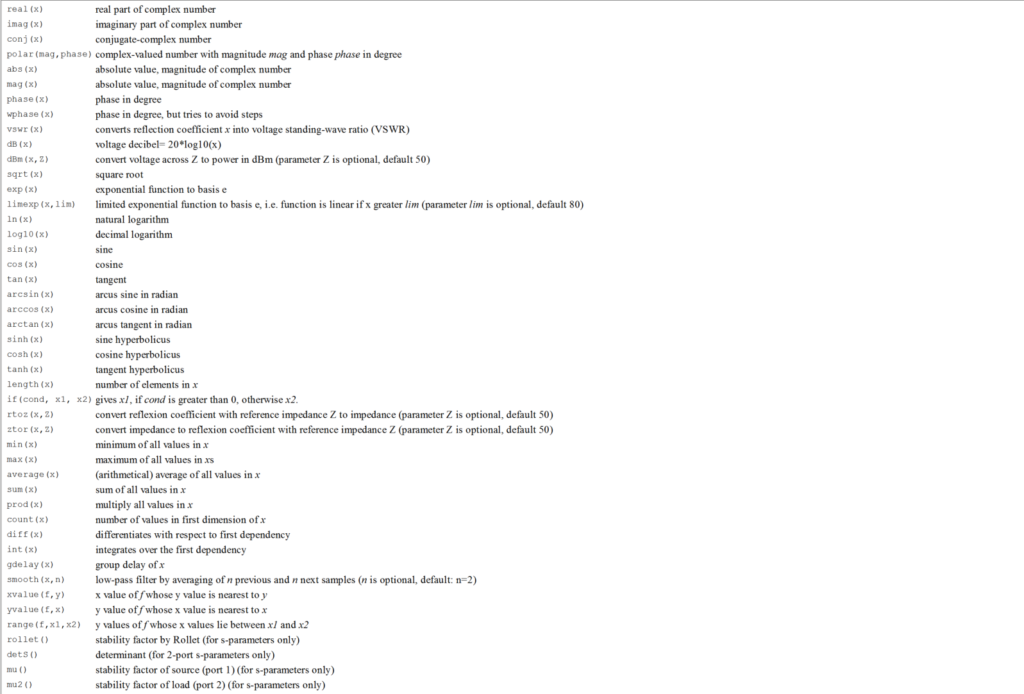
5.3 Predefined Functions
QucsStudio incorporates by default numerous functions that can be used directly in the diagrams and, in some cases, also in the equations explained above. Some of the most relevant functions are listed below:

5.4 Post-Processing with Octave and C/C++
QucsStudio includes support for Octave and C/C++ as explained in section 6 below. This support makes the analysis of simulation results much more flexible.
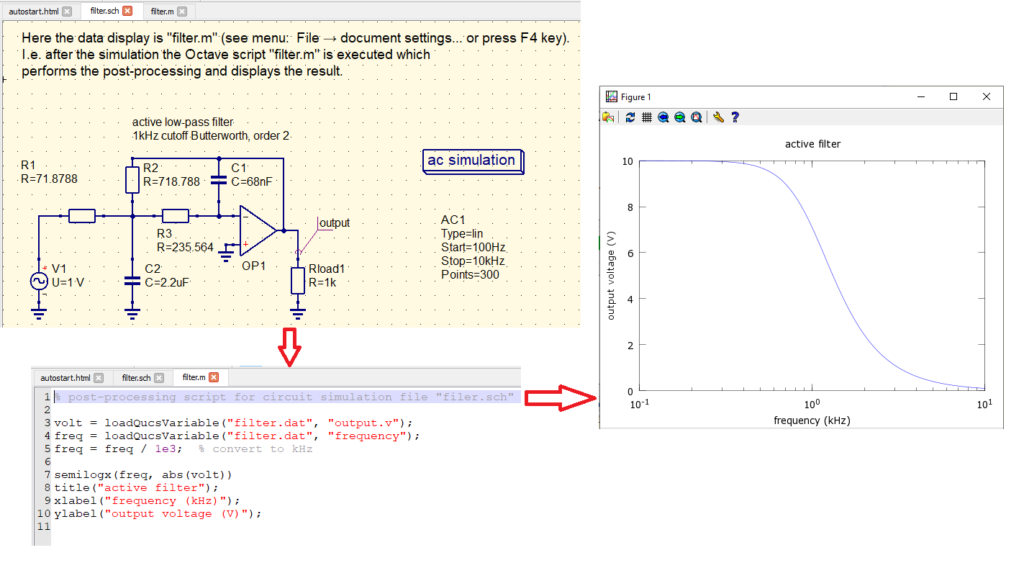
In a simple way, QucsStudio can be instructed to run an Octave script, with all its functionality, at the end of a simulation to post-process the results. Also, the Octave script can execute functions written in C/C++ and compiled as MEX files. Obviously, from Octave it is also possible to represent results and post-processed variables with its native graphical interface.
The following example shows a simple analog simulation where the results are processed and presented from Octave:
6. Utilities in QucsStudio
This section reviews other utilities included in QucsStudio, mainly apps and support for different programming languages.
6.1 Apps
Along with typical functionalities for this type of tool such as creating bills of materials, QucsStudio features more complex applications which are described below. In addition to those mentioned below, there is also an application to control instrumentation via GPIB, and a gerber viewer (Gerbview).
6.1.1 Component Designer
This tool includes an additional graphical interface for designing the following types of components:
- Coils: traditional, conical, multilayer and monolayer spiral.
- Capacitors: bilayer, with parallel lines and with interdigital lines.
The following image shows the graphical interface of the application:

6.1.2 Filter Synthesis
Qucstudio also has a utility that allows you to design filters of various types, both with discrete and distributed components, as well as with equations. The following video shows an example of filter design from this application:
6.1.3 Transmission Line Calculator
For RF circuit design, QucsStudio also has its own transmission line calculation tool. It includes different variants of the following possibilities: microstrip, stripline, coplanar, waveguide and coaxial lines.
The following video shows the operation with this application:
6.1.4 Attenuator Synthesis
This useful tool allows you to calculate the resistances of the most common attenuators and power dividers from the attenuation and the input/output impedance values. Given the input power, the application also calculates the power dissipated in each resistor. It also allows to select the resistor values closest to the ideal ones according to the family, and to see how the attenuator is affected.
The following image shows the graphical interface of this application:

6.1.5 Impedance Matching
QucsStudio also has a simple tool to perform automatic impedance matching at one frequency. Given some S-parameters, the application allows to obtain the simple matching network for one port, or the simultaneous matching network for two ports. It automatically obtains the components that can be pasted into the schematic with the circuit to be matched.
The following image shows the graphical interface of this tool:

6.2 C/C++ support
QucsStudio supports C/C++ globally, not only for defining and modeling components as explained above in section 4.4.
From the tool you can easily open, generate and edit the “.cpp” text files, since it automatically highlights the keywords. Once the C/C++ files are compiled (with the F2 key) an “.exe” file is generated which is also executable from the tool. This allows programming applications with various functions such as writing data via the QucsStudio console, reading/writing external files or controlling devices via GPIB.
On the other hand, with the appropriate directives, C/C++ files can also be compiled as “.mex” files, which are interpretable by Octave (as explained below).
6.3 Octave Support
QucsStudio incorporates Octave, allowing you to generate, open, edit and run scripts from within the tool. Similar to C/C++, the built-in text editor also highlights Octave keywords.
In this way it is possible to write applications in Octave with all its native capacity of internal functions, both for processing and for interaction with the outside (file reading/writing, commands to external ports and graphics display). It is also possible to write applications in Octave that generate a QucsStudio schematic automatically from key parameters defined as inputs.
By incorporating simultaneous native support for C/C++ and Octave, Qucstudio allows integrating both languages through “.mex” files (compiled from C/C++). In this way, mixed applications can be written in Octave, using functions written and compiled from C/C++, with full native Octave support.
Finally, it is also possible to post-process the results of a QucsStudio simulation from Octave, as explained above in section 5.4. This functionality also allows to perform a simulation of different domains in batches. For example, it is possible to perform a traditional QucsStudio simulation (analog/digital/system) and then take the results to simulate with Octave/C/C++ digital signal processing (DSP) functions that would be implemented at other stages.
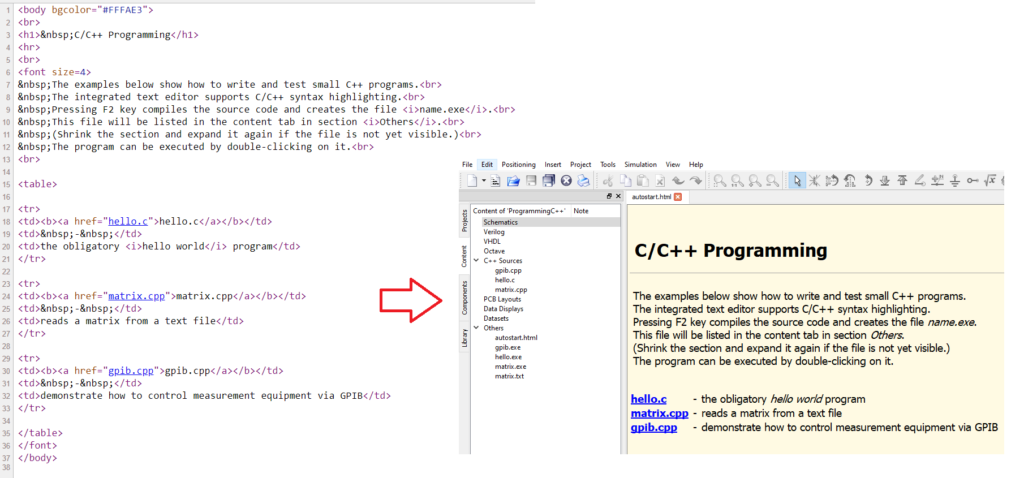
6.4 HTML Suppport
QucsStudio also interprets HTML files. This utility is very useful, for example, to integrate a page in each project with shortcuts and explanations to each of the files contained in the project. This strategy is used in the QucsStudio examples to facilitate the user’s understanding, as shown in the following image:
7. QucsStudio Conclusions and Evaluation
QucsStudio is a very useful free tool for electronic and RF engineers and designers. The simulation capabilities are very flexible and mechanisms are provided to model missing components according to the designer’s needs. The operation of the tool is very easy and in general intuitive. In addition, the graphical interface is very attractive both in the presentation of schematics and in the presentation of results. In general, even in professional environments, QucsStudio is a very useful tool for the user.
Obviously, QucsStudio also has its limitations. It is sometimes frustrating to find that a simulation stops converging when a parameter is slightly changed. In general, using QucsStudio requires a deeper knowledge than other tools, typically paid tools, where the convergence of simulations is more refined. This can lead to unexpected delays in the design process.
Therefore, it can be concluded that QucsStudio is a powerful and highly recommended tool for tasks related to electronic design. Naturally, it is in the comparisons with paid tools where QucsStudio’s weaknesses can be found. Nevertheless, it is very remarkable that version by version QucsStudio has not stopped growing by incorporating more and more complex functionalities such as electromagnetic simulation.
Subscription
If you liked this contribution, do not hesitate to subscribe to our newsletter:
